
With the US Midterm elections now out of the way, the team takes a look at US Treasury flows on both sides of the Atlantic. We consider cross-jurisdiction issues and dive into de-duplication, uncovering some very interesting trends.


In the modern era, US Treasury reporting mainly occurs in two jurisdictions, domestically within the US and pan-European wide under the MiFID regime.
FINRA govern trade reporting for fixed income securities in the US and they offer the public dissemination of prices via TRACE, however unlike corporate bonds, US Treasury prices are only every disseminated at the end of each trading day for on-the-run fixed rate securities only1. Additionally certain price caps are in place, as shown in Figure 1 below.
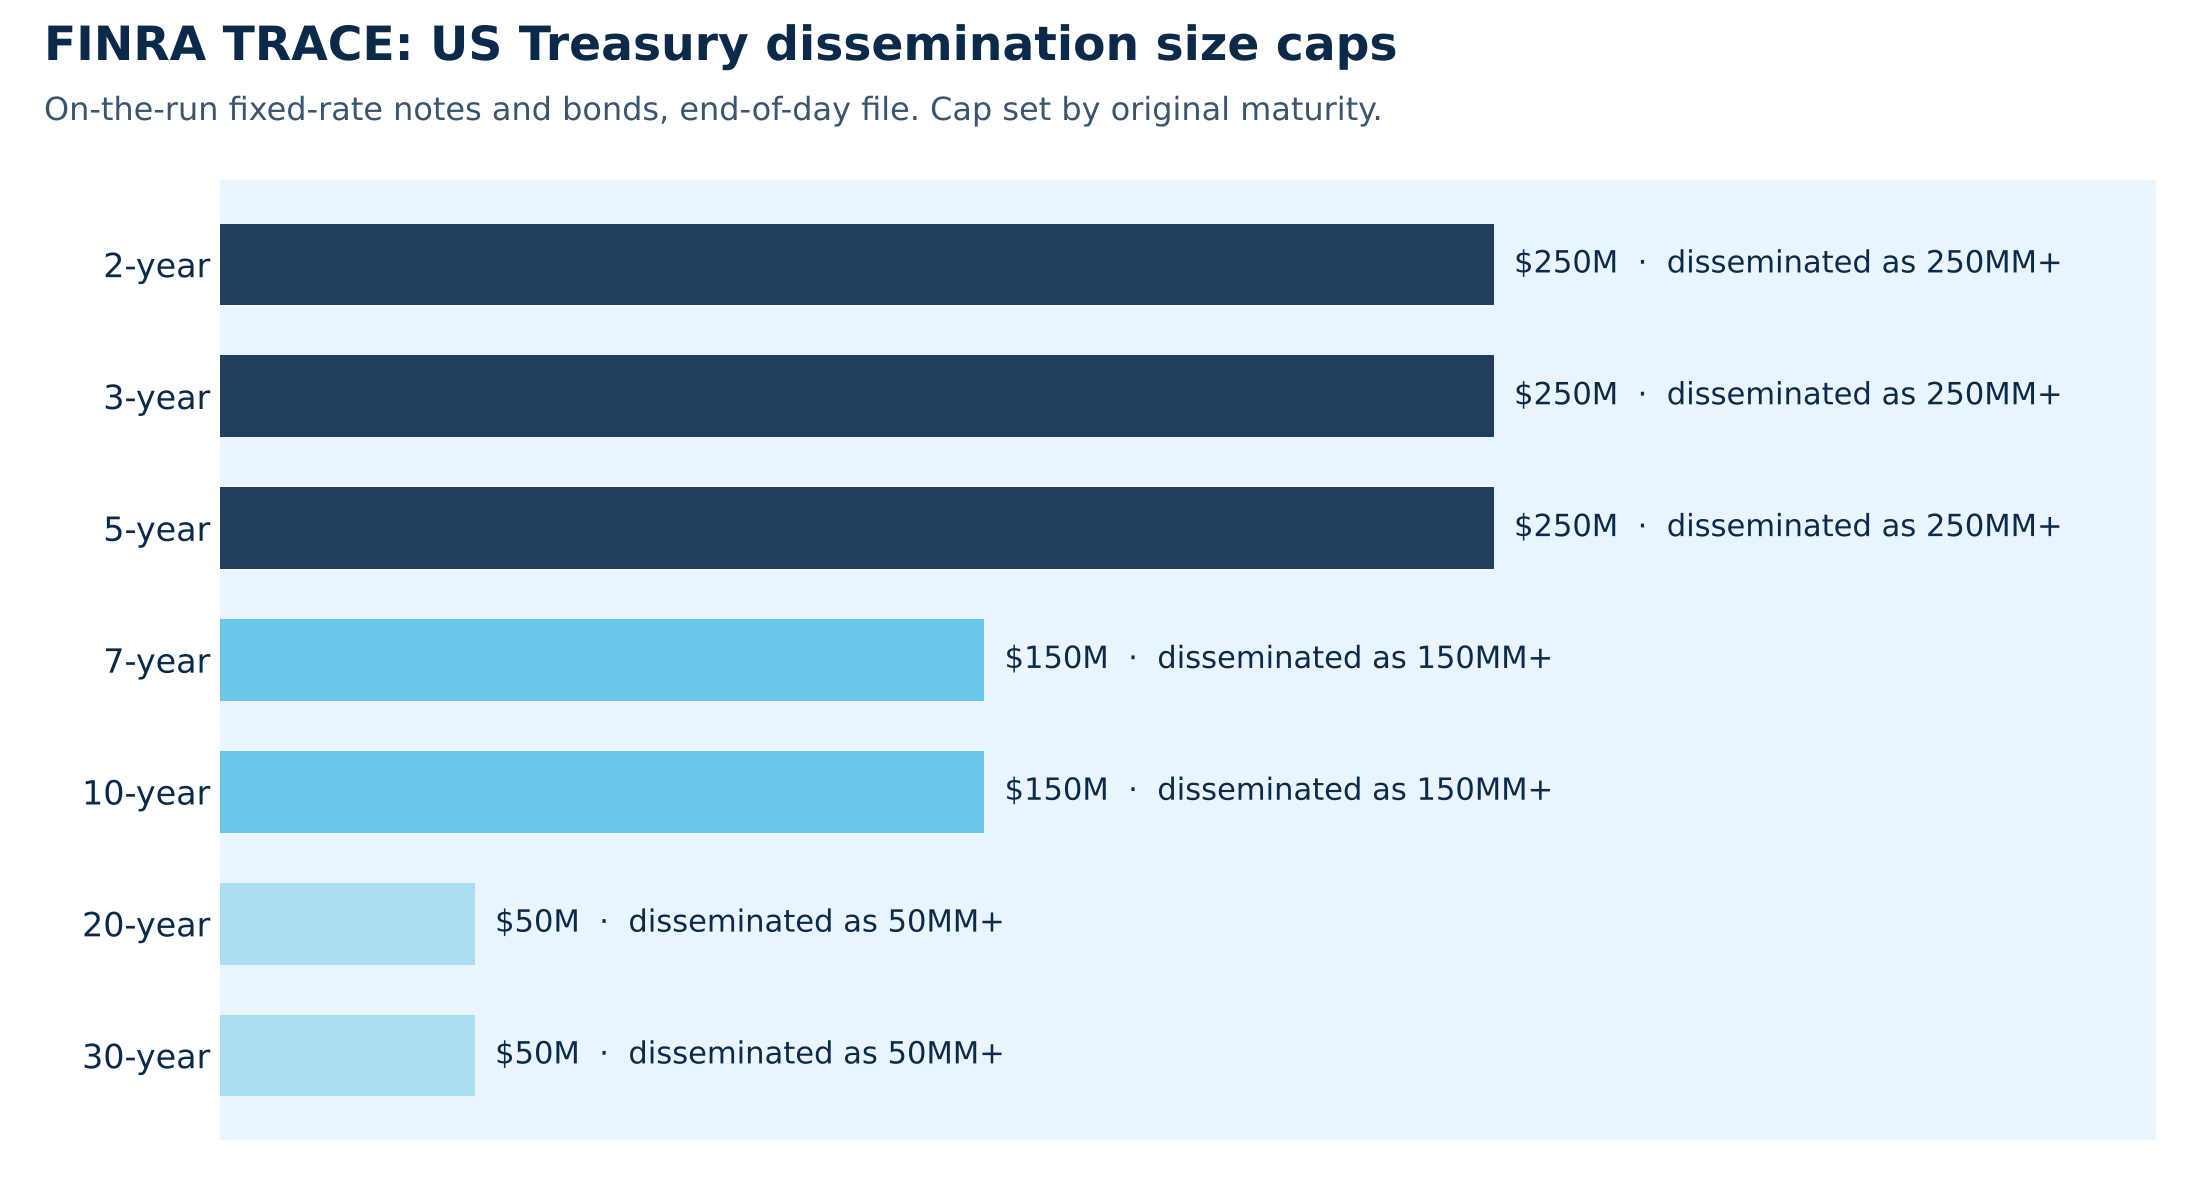
It should also be noted that although the end of day data provided by FINRA does contain capped notionals (as per Figure 1 above), they do also release the uncapped notional values for the quarter which ended 6 months ago (for example in March 2027, data would be available up until September 2026).
When it comes to European regulation, the rules for public price dissemination are quite different as we will see over the page.
Firstly we take a look at ESMA’s deferral rules for sovereign bonds in Figure 2 below.
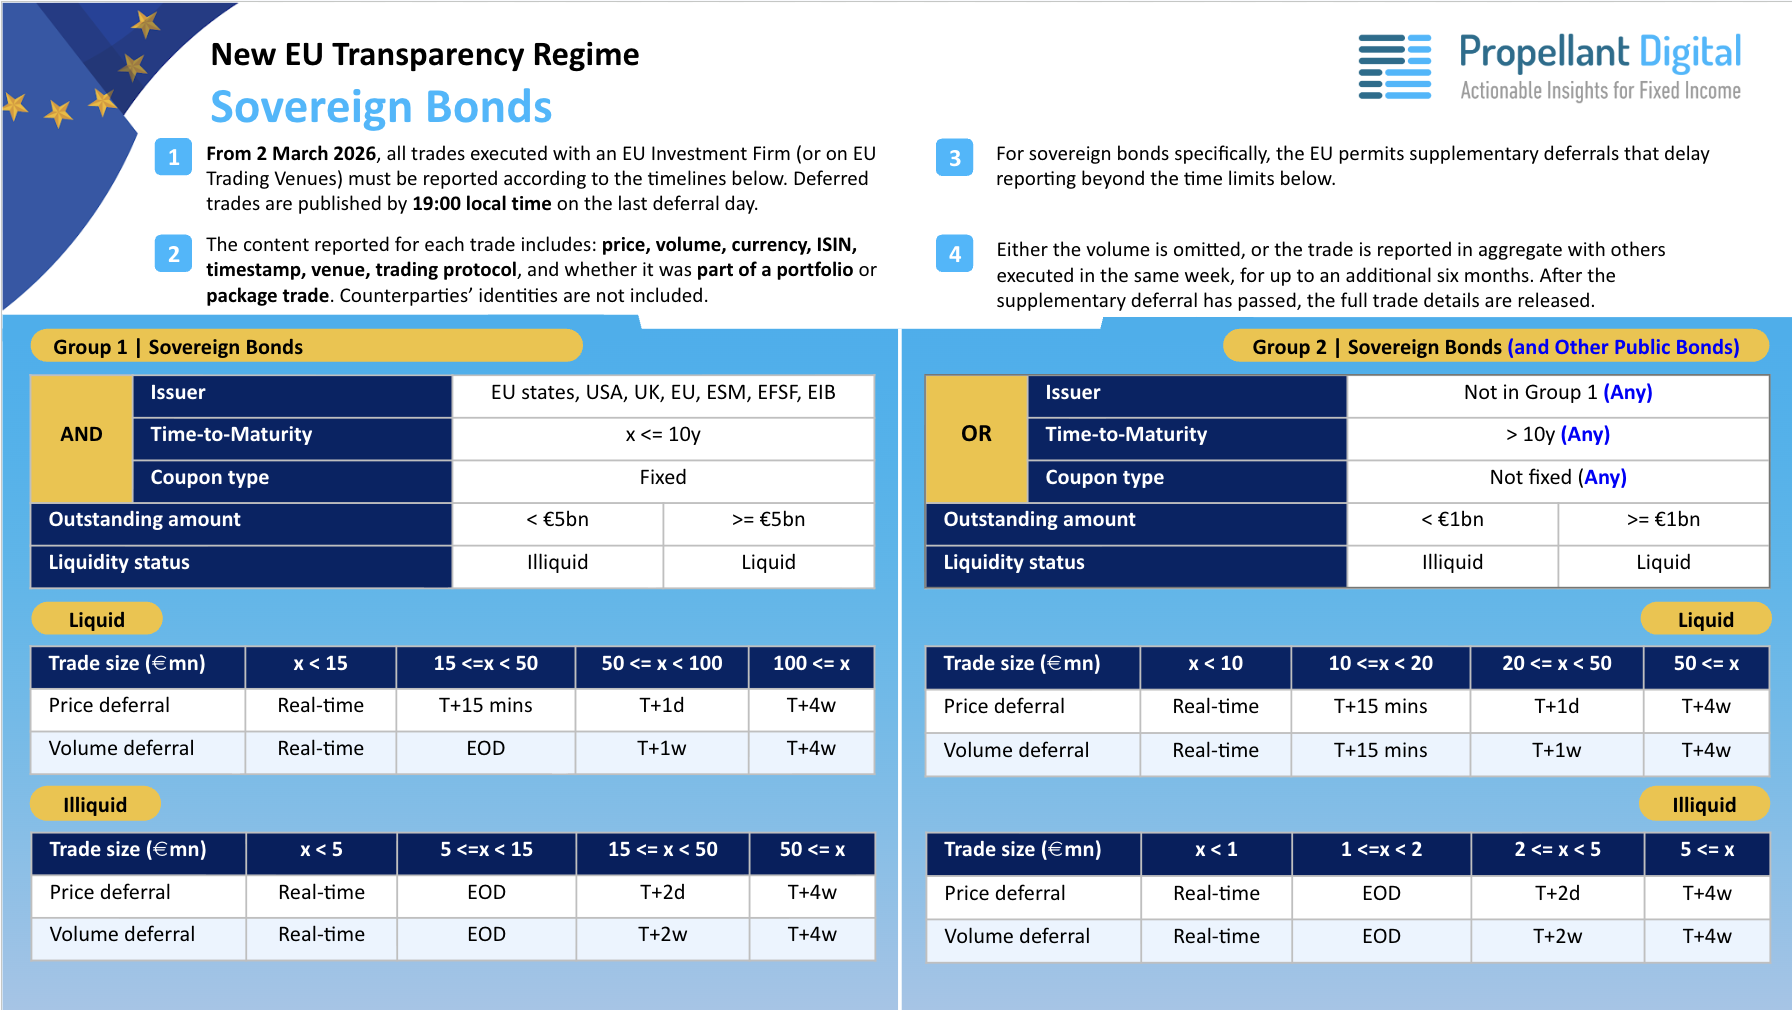
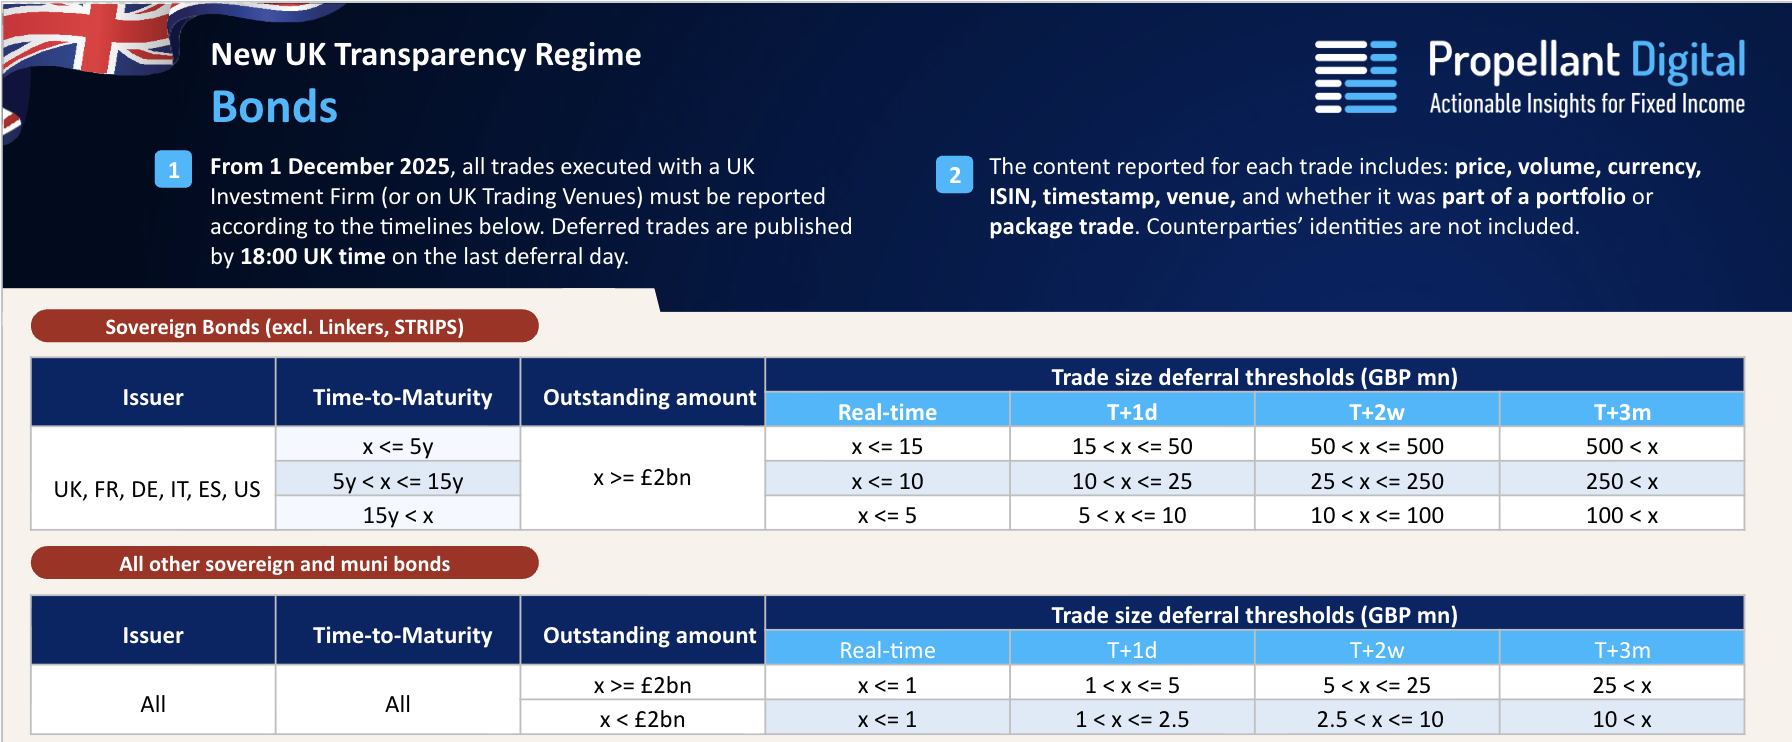
Unlike FINRA, the reporting rules here do not cap trade sizes, but instead defer the dissemination of a trade until a future point in time, based on the trade size and type. In Figure 3 below, we can see the FCA approach, which is similar, but applies different thresholds and has different deferral time periods.
Having looked at the differences between the various regimes we now move onto looking at the data itself. In Chart 1 below we consider the volumes observed via MiFID alongside the data obtained via FINRA on the day of the midterm elections and one day either side.
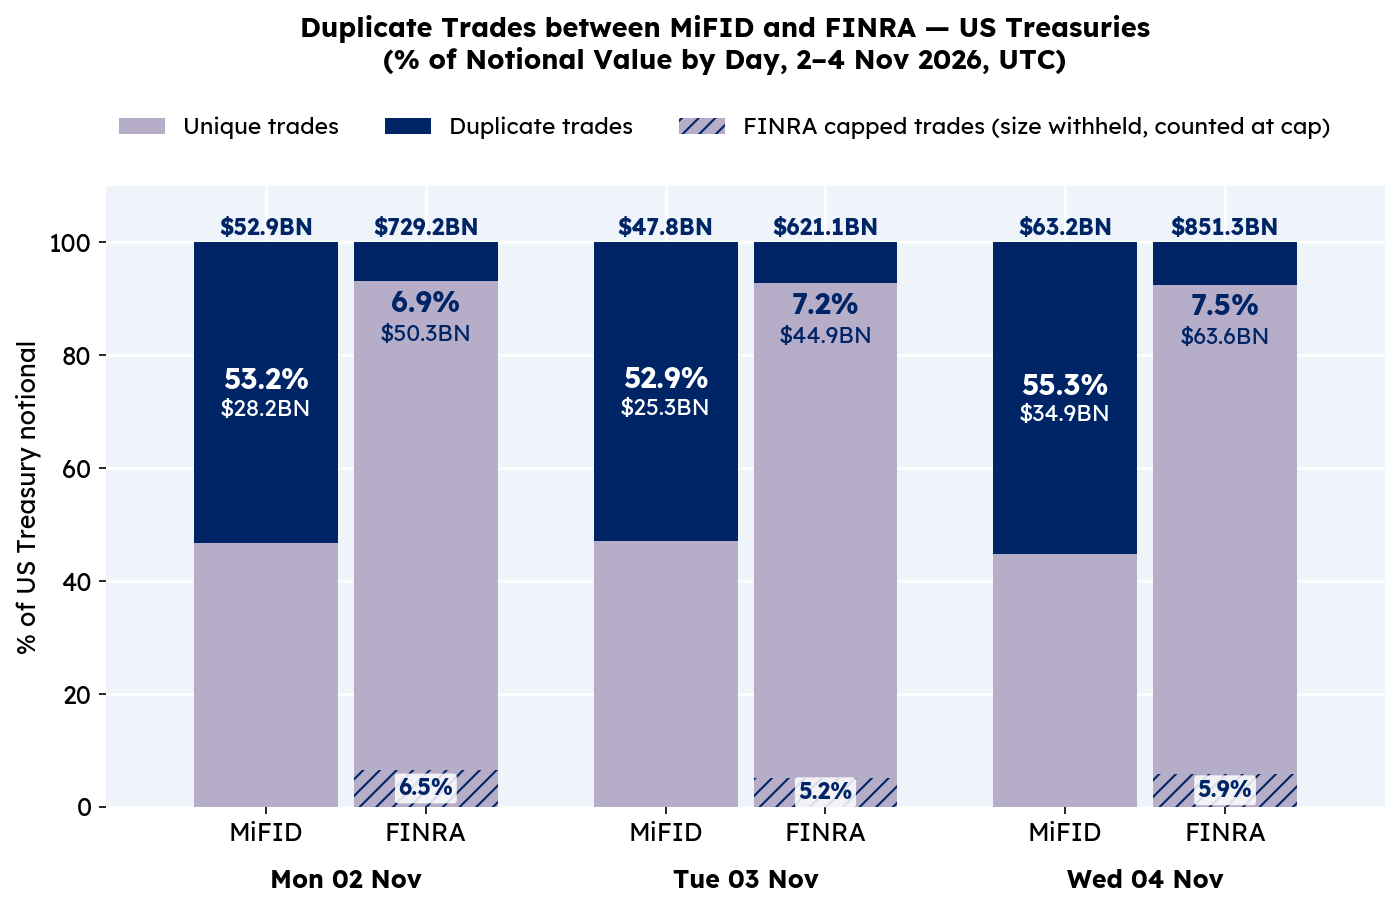
Unsurprisingly even though only on-the-run volumes are reported via FINRA, the volumes are orders of magnitude higher than those reported under MiFID.
What may be of more interest is the amount of dual reporting between the two regimes, meaning that looking at both datasets without de-duplicating could result in a significant overestimation of the true volumes traded.
Additionally it is important to highlight that the FINRA data does not include TIPS or off-the-run fixed rate bonds (unlike the MiFID data, which we will look into this breakdown later on). Furthermore, as the FINRA data caps trades above a certain size, the true duplicate count may be even higher (as some trades will not match on the notional).
Volumes of course do not tell the full story. We also want to look at how the US yield curve shifted over the election period.
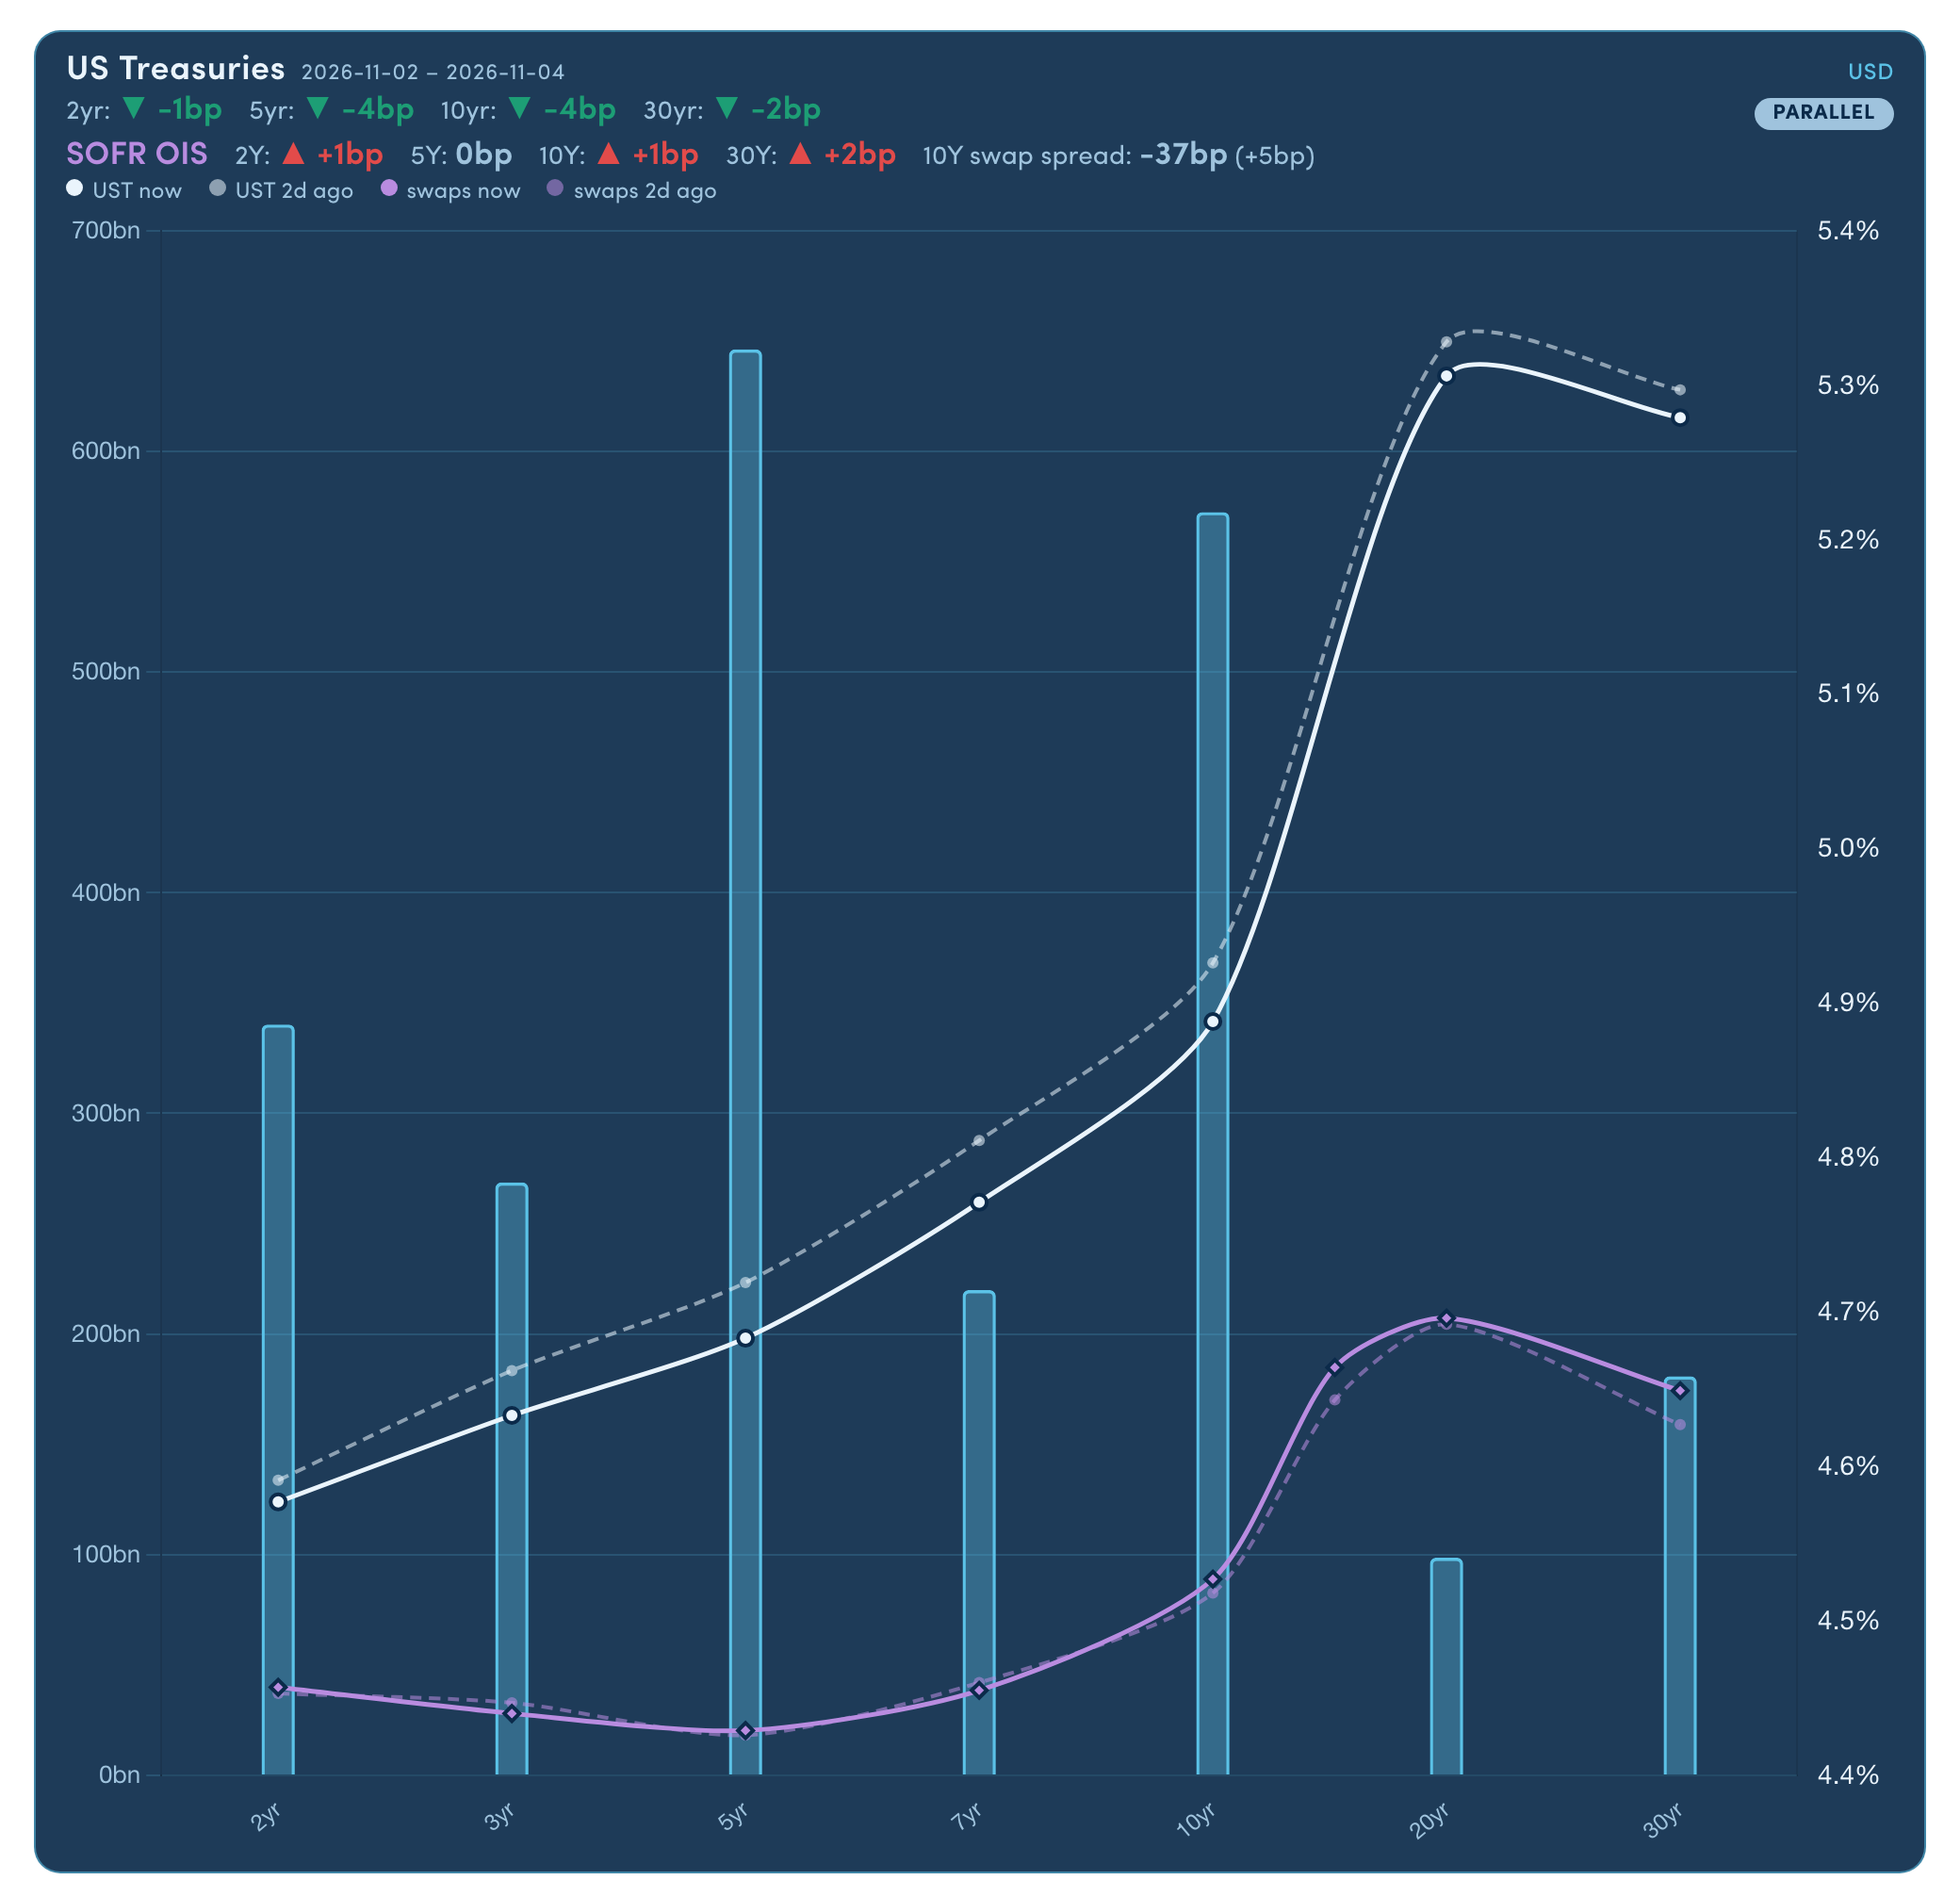
Chart 2 shows volumes for fixed rate bonds over the 3 days in-scope, along with the curve shift. The 5 and 10 year issues were the most liquid, which is to be expected as these are often considered the most liquid tenor points on a typical government yield curve.
“The curve itself shifted in a parallel fashion downwards (implying the market perceived US Treasuries to be slightly less risky by the end of the period). Additionally the swap spread (the swap rate - the bond yield) at the 10 year point in the curve compressed slightly by 5 basis points (we will look into swap spreads more in another edition).”
FINRA only includes on-the-run activity and this is where the MiFID data proves to be a valuable addition. Whilst the US Treasury volumes reported domestically far outweigh those reported in Europe, what the European data offers (aside from real-time reporting) is the ability to see off-the-run fixed rate bonds, as well as TIPS and FRNs.
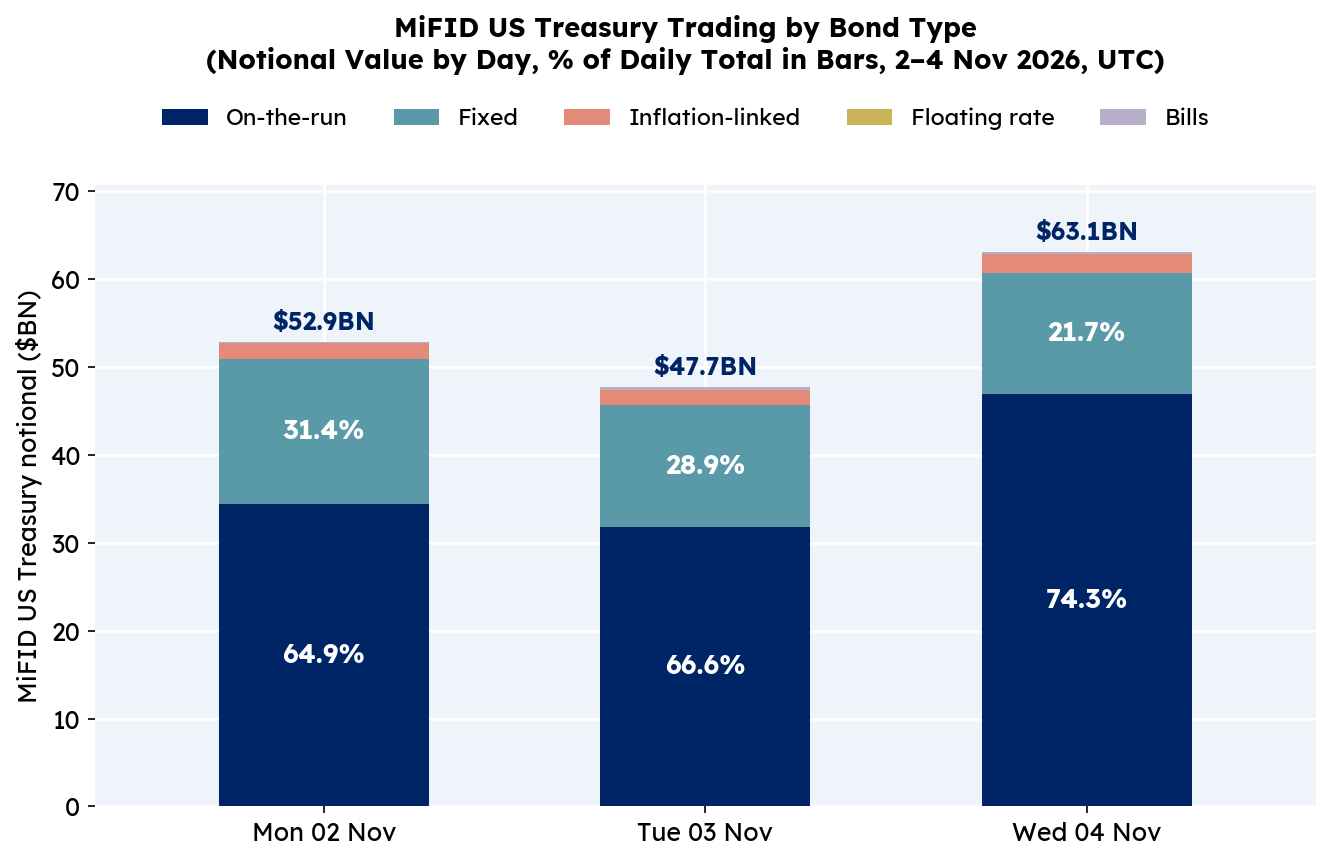
Chart 3 shows the value of the MiFID data, breaking down the European volumes by category, to see the true split. Over the period we saw volumes totalling ~$2.2 Tn across on-the-run fixed rate bonds, split between FINRA and MiFID. Off-the-run bonds, along with floaters, linkers and bills totalling ~$45 Bn from just MiFID reporting.
“Combining the FINRA and MiFID data allows us not just to see the proportion that trades in each location, but by de-duplicating it also gives us a much clearer picture of the true volumes. Whilst we cannot be sure of the full domestic activity, we can at least gain some insight into the likely proportions by extrapolating from the MiFID data.”

1https://www.finra.org/sites/default/files/2024-03/Regulatory_Notice_24-06.pdf
Vidal Mehra - Vidal is Chief Product Officer for Propellant Digital and the lead author for Propellant Insights.
He has been working with financial institutions for over 20 years across multiple disciplines including front office and consulting roles.
Helena Roughton - Helena recently joined the team as a Product Manager, bringing extensive MiFID policy experience having previously worked at AFME.
She also brings product remediation and data analysis experience from the Bank of New Zealand.