Coverage

The most comprehensive fixed income market view - covering US, UK, and EU bonds, derivatives, and ETFs in one unified platform. Our solutions turn complex market data into actionable insights, ready to integrate across your systems.

Average monthly transactions by region

Transparency for Sovereign Bond markets is changing

Regulatory data sets under the MiFID regime and FINRA TRACE include price and volume data on recent or historic transactions.
KEY BENEFITS

Near real-time transaction data, with timestamp, price and size, streamed directly to your device

Rapid dissemination of trade reports
Get trade reports as soon as they are made publicly available.
Volumes update every tick
See intraday volumes update live.
Go further with analytics
Enhance the raw data with yields and other analytics

Sovereign Bond Trading September 2025

Corporate Bond markets are becoming less opaque

Due to the OTC nature of the Corporate Bond markets, post-trade data has been difficult to obtain and analyse.
KEY BENEFITS

OTC & Exchange flows can be obtained from one single source

Rapid dissemination of trade reports
Get trade reports as soon as they are made publicly available.
Volumes update every tick
See intraday volumes update live.
Rapid dissemination of trade reports
Enhance the raw data with yields and other analytics.

Corporate Bond Trading September 2025

See all European ETF activity in one place

Due to the OTC nature of Sovereign Bond markets, it has been traditionally hard to obtain data on recent or historic transactions, this has now changed.
KEY BENEFITS

Near real-time transaction data, with timestamp, price and size, streamed directly to your device

Improved decision-making
Get trade reports as soon as they are made publicly available.
Future-proofing
See intraday volumes update live.
Enhanced efficiency and cost reduction
Enhance the raw data with yields and other analytics.

7,500 ETFs captured

EU Market Region
ETF Units Traded 92,146,306,689.84
Total Transactions 20,256,310.00
Volume (USD) $1,873,077,628,960.64
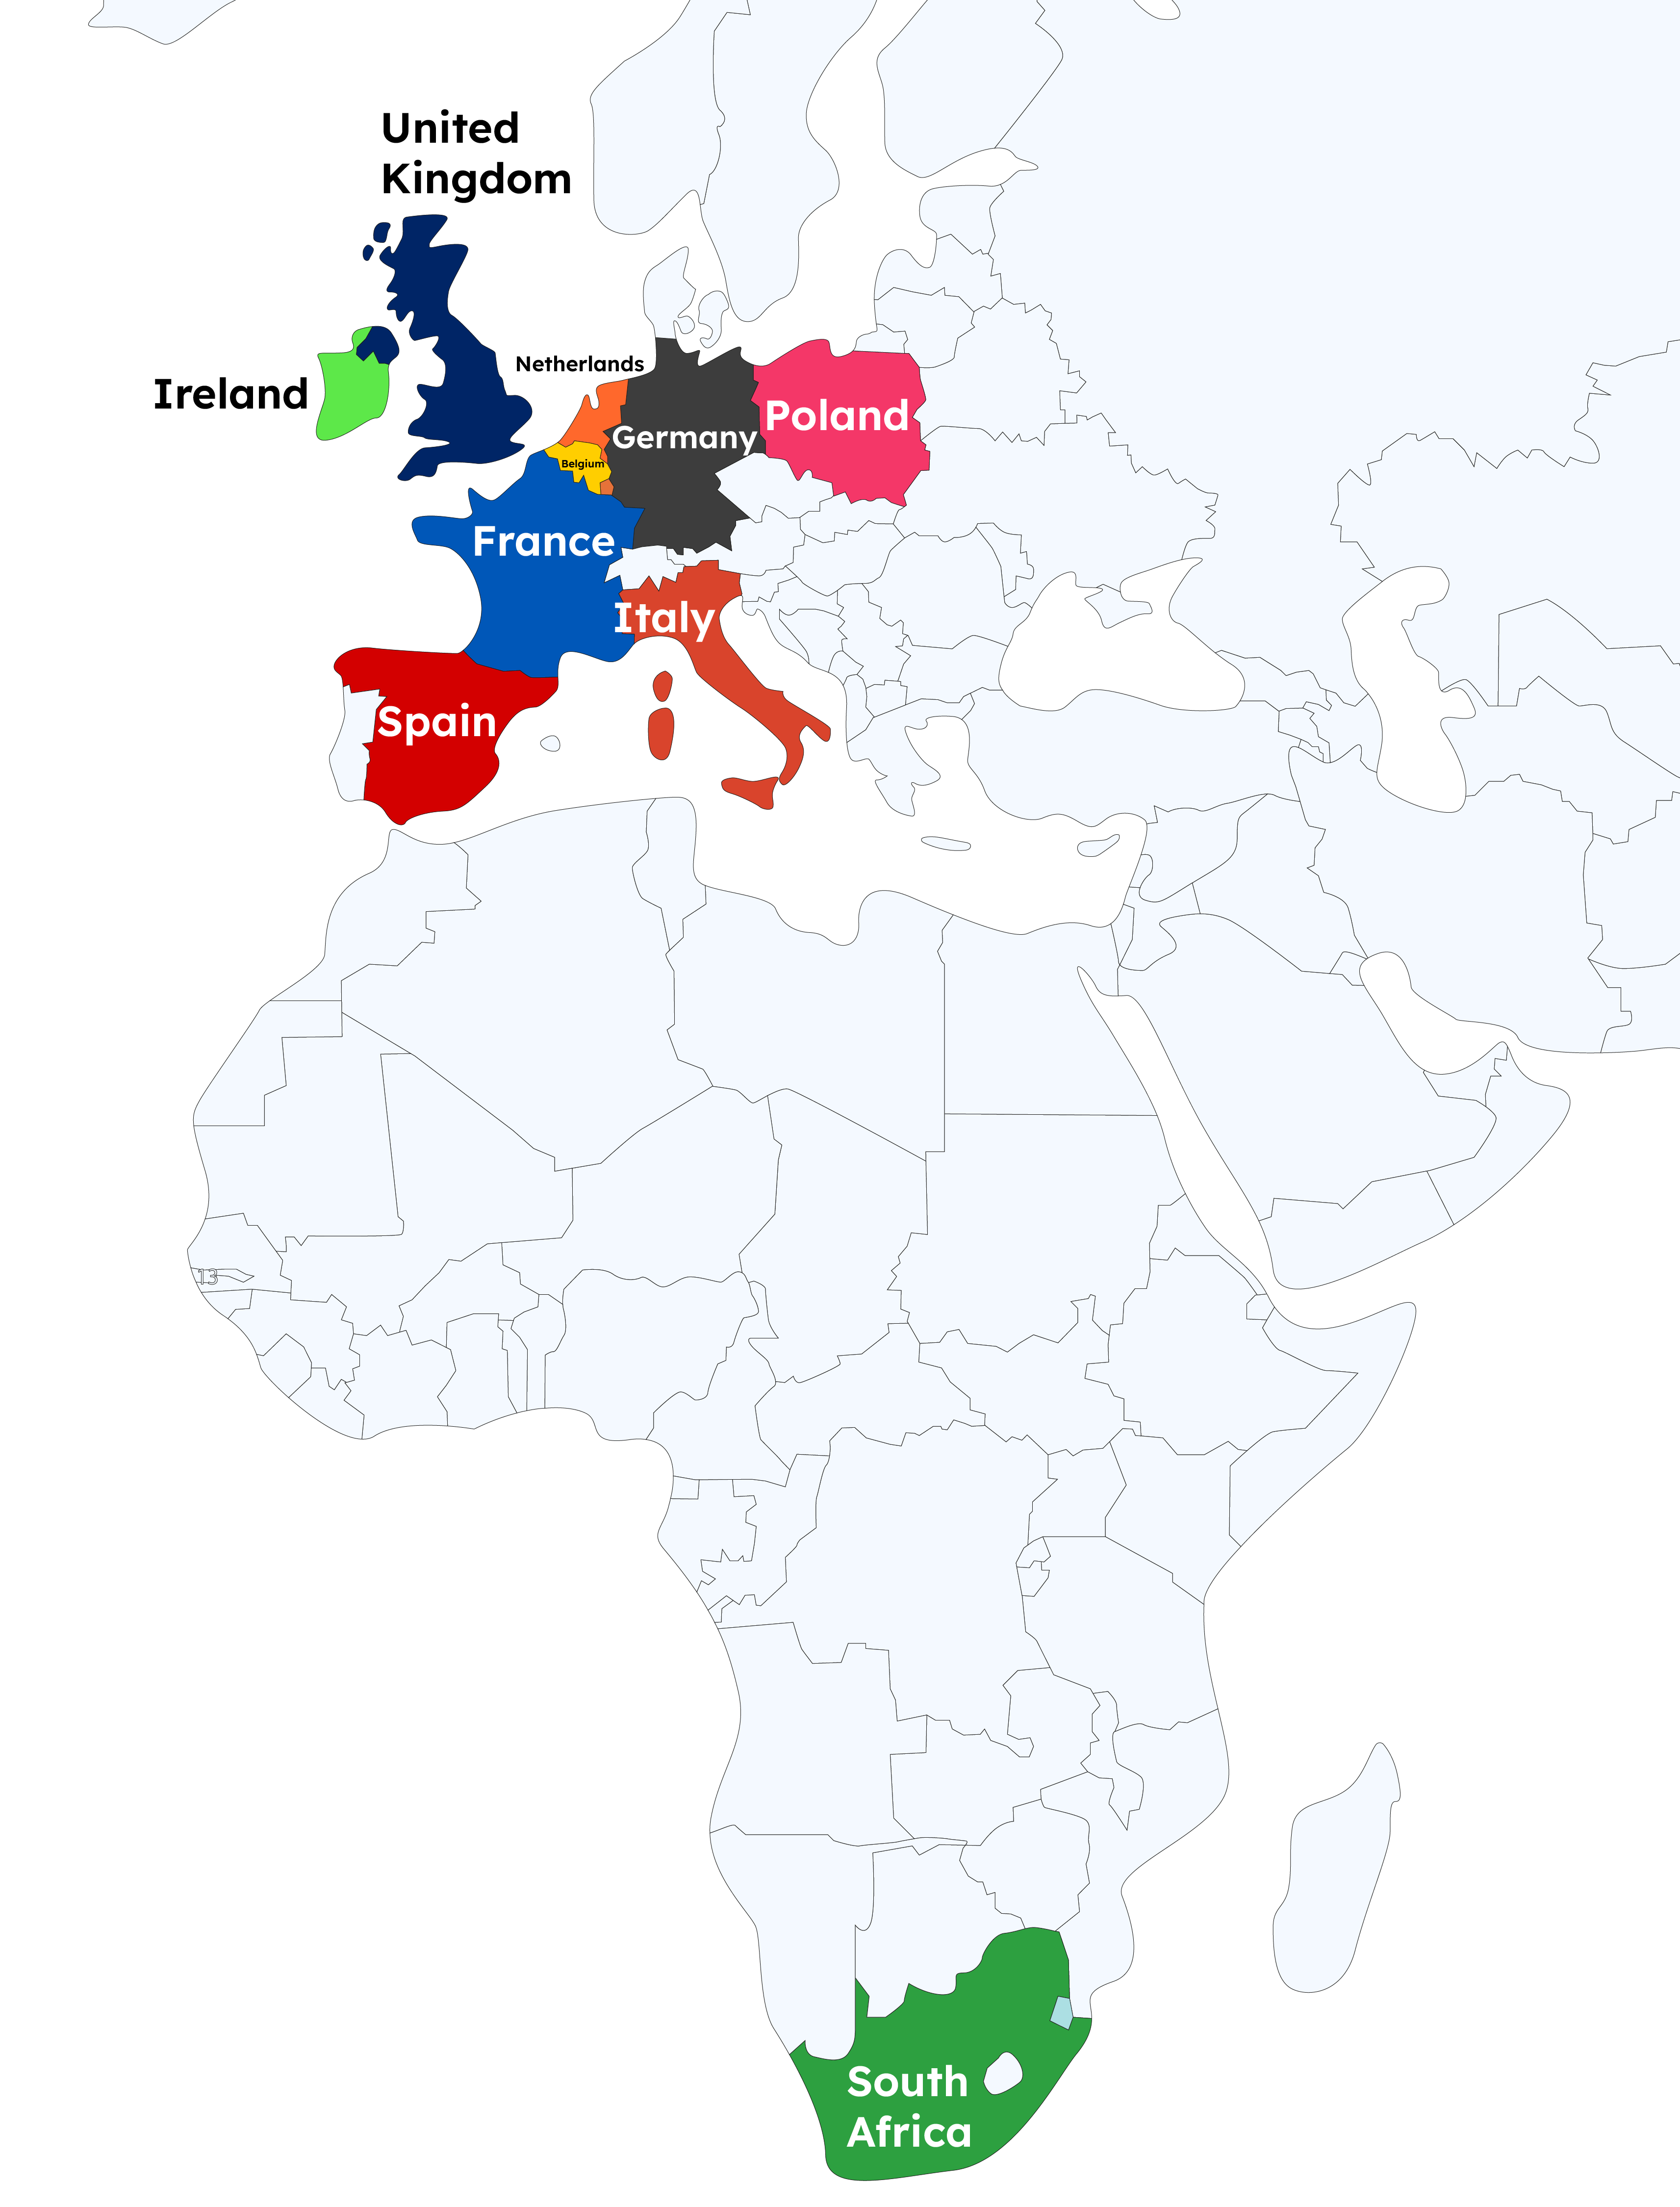
UK Market Region
ETF Units Traded 55,344,701,688.30
Total Transactions 20,587,972.00
Volume (USD) $719,514,696,628.14
Total EU + UK
ETF Units Traded 147,491,008,378.14
Total Transactions 40,844,282.00
Volume (USD) $2,592,592,325,588.78

See swap activity from around the world, all in one place

Propellant allows you to connect to sources throughout Europe and the US in order to provide a tape-like view of global IRS activity.

List of currencies captured

๐Ÿ‡ฆ๐Ÿ‡ช AED
๐Ÿ‡ฆ๐Ÿ‡บ AUD
๐Ÿ‡ง๐Ÿ‡ท BRL
๐Ÿ‡จ๐Ÿ‡ฆ CAD
๐Ÿ‡จ๐Ÿ‡ญ CHF
๐Ÿ‡จ๐Ÿ‡ฑ CLP
๐Ÿ‡จ๐Ÿ‡ณ CNY
๐Ÿ‡จ๐Ÿ‡ด COP
๐Ÿ‡จ๐Ÿ‡ฟ CZK
๐Ÿ‡ฉ๐Ÿ‡ฐ DKK
๐Ÿ‡ช๐Ÿ‡บ EUR
๐Ÿ‡ฌ๐Ÿ‡ง GBP
๐Ÿ‡ญ๐Ÿ‡ฐ HKD
๐Ÿ‡ญ๐Ÿ‡บ HUF
๐Ÿ‡ฎ๐Ÿ‡ฑ ILS
๐Ÿ‡ฎ๐Ÿ‡ณ INR
๐Ÿ‡ฏ๐Ÿ‡ต JPY
๐Ÿ‡ฐ๐Ÿ‡ท KRW
๐Ÿ‡ฒ๐Ÿ‡ฝ MXN
๐Ÿ‡ฒ๐Ÿ‡พ MYR
๐Ÿ‡ณ๐Ÿ‡ด NOK
๐Ÿ‡ณ๐Ÿ‡ฟ NZD
๐Ÿ‡ต๐Ÿ‡ฑ PLN
๐Ÿ‡ท๐Ÿ‡บ RUB
๐Ÿ‡ธ๐Ÿ‡ฆ SAR
๐Ÿ‡ธ๐Ÿ‡ช SEK
๐Ÿ‡ธ๐Ÿ‡ฌ SGD
๐Ÿ‡น๐Ÿ‡ญ THB
๐Ÿ‡น๐Ÿ‡ท TRY
๐Ÿ‡น๐Ÿ‡ผ TWD
๐Ÿ‡บ๐Ÿ‡ธ USD
๐Ÿ‡ฟ๐Ÿ‡ฆ ZAR

Traded Notional (USD) Per Currency

KEY BENEFITS

See whenever a trade is posted under MiFID or CFTC Regulation 43

Rapid dissemination of trade reports
Get trade reports as soon as they are made publicly available.
Propellantโ€™s GUI keeps you up-to-date
See intraday volumes update live via the Propellant GUI.
Perform time series analysis
Track intraday or historic movements across all reported swap contracts.

Number of IRS Transactions Per Tenor Bucket

G3+GBP IRS Coverage

Index and Single Name CDS have been historically opaque

Now you can get a near real-time streaming feed of transactions as they occur across Europe and the US.

Single Name CDS Average Notional Volumes Per Month (USD Equivalent)

KEY BENEFITS

Near real-time transaction data, with timestamp, price and size, streamed directly to your device

Improved decision-making
Get trade reports as soon as they are made publicly available.
Stay ahead with the Propellant's GUI
See intraday volumes update live via the Propellant GUI.
Perform time series analysis
Track intraday or historic movements (even across different Index series).

Index CDS Average Notional Volumes Per Month (USD Equivalent)

Sources

Sovereign bond markets are no longer a data blind spot. Through direct connectivity to primary trading venues and reporting sources where the most trading activity happens, our platform delivers the transparency these markets have long lacked.
See full list of MICs โ€บ

Venues by Type

Number of Market Identifier Codes (MICs)

10 APA
53 MTF
16 OTF
10 RM
Total
89 (EU & UK venues)
Propellant venues by country

A consolidated view of global fixed income markets

Access a single, central source for all market and reference data content.

Contact our team