
The UK Bond Transparency Regime: An Empirical Analysis of the Intraday Publication Profile
.png)
This paper presents an empirical analysis of the intraday publication profile of bond transaction data published by UK trading venues and Approved Publication Arrangements under the new UK transparency regime, which commenced on 1 December 2025. It does not advocate for any particular contractual or commercial outcome. Its purpose is to make the publication data accessible to market participants, regulators, and policymakers – including those involved in the design and operation of the forthcoming UK Bond Consolidated Tape, which is expected to go live in June 2026. All findings are derived from the free 15-minute delayed data published by regulated trading venues and Approved Publication Arrangements in accordance with their MiFID transparency obligations.
The new UK bond transparency regime commenced on 1 December 2025. The UK Bond Consolidated Tape ("CT"), to be operated by ETS Connect UK as the designated Consolidated Tape Provider ("CTP"), is expected to consolidate this data from June 2026.
This paper analyses the intraday publication profile during the regime's first two full weeks – 1 to 12 December 2025 – across 14 contributing trading venues and APAs, using the free 15-minute delayed feed. Four findings stand out.
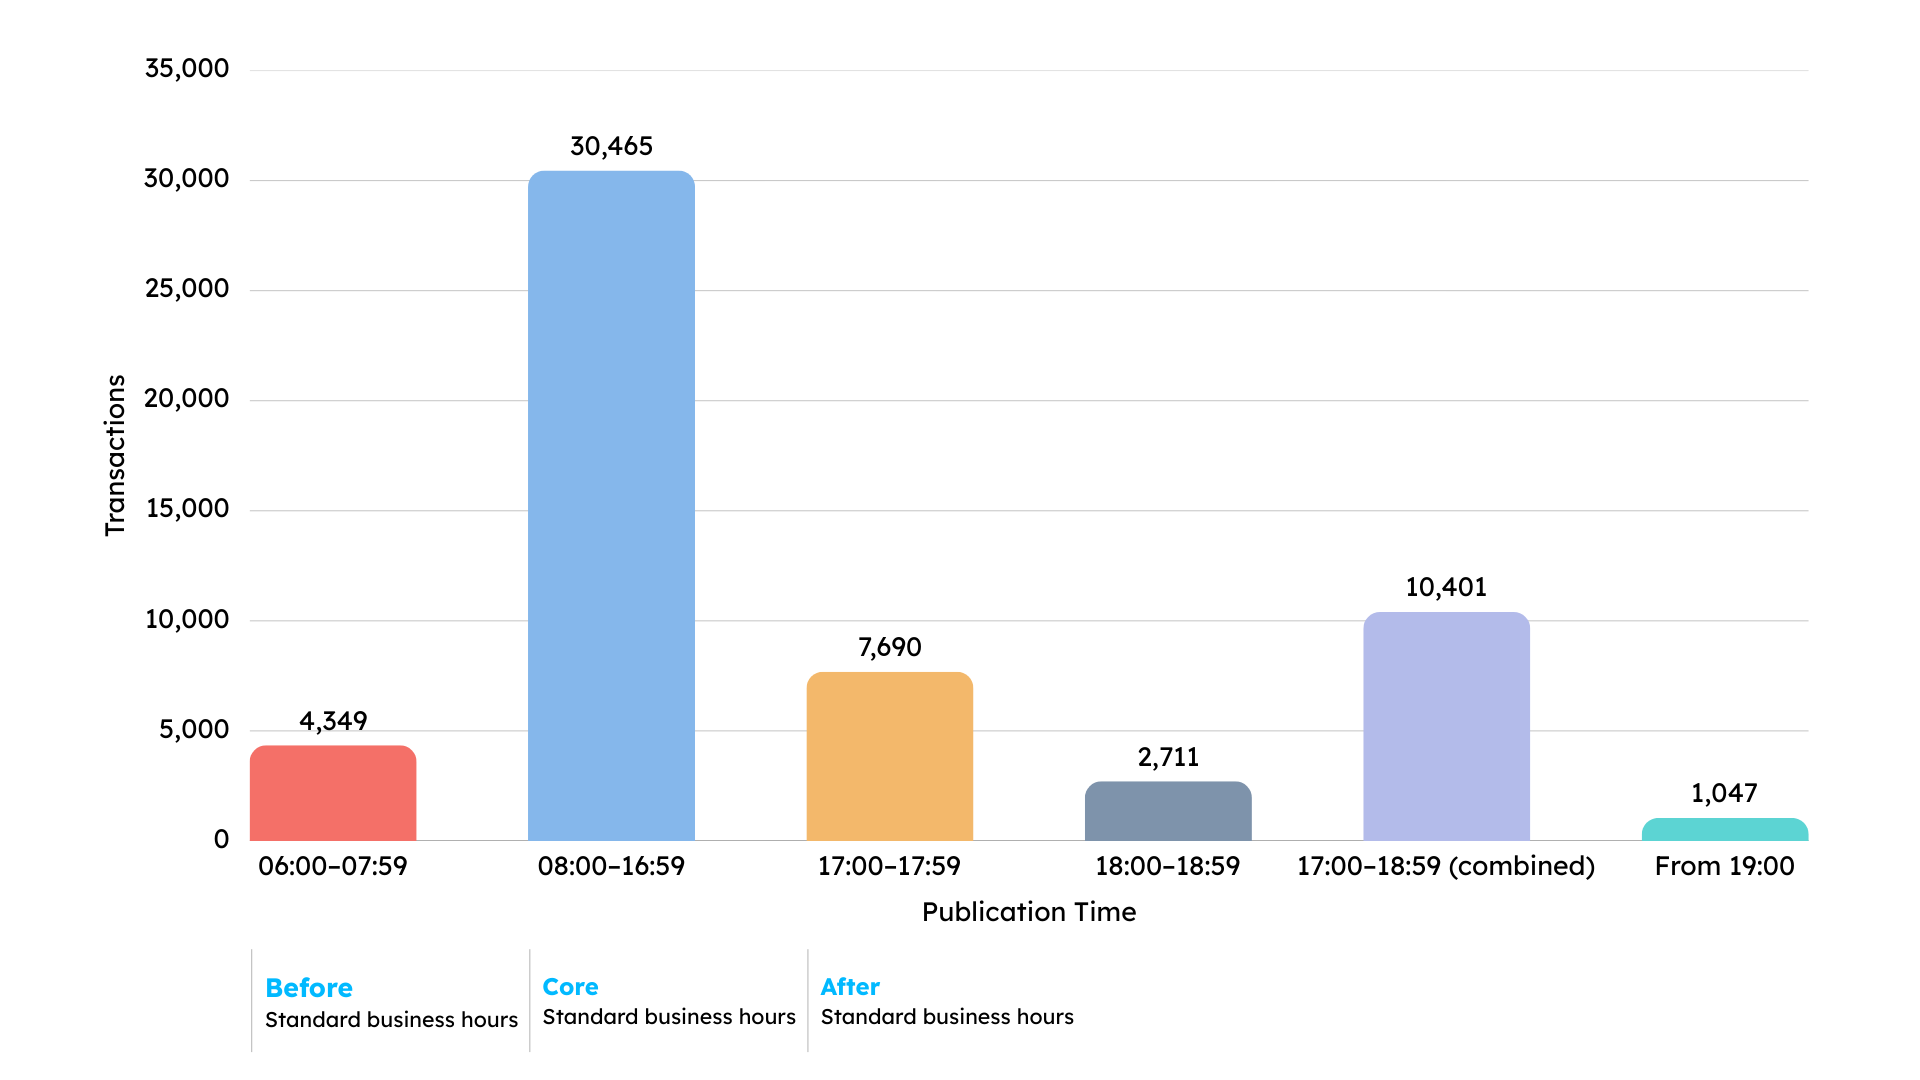
- A material share of daily transactions – approximately 34% – is published outside 08:00-16:59. The 17:00-18:59 window alone accounts for approximately 22.5% of all daily transactions.
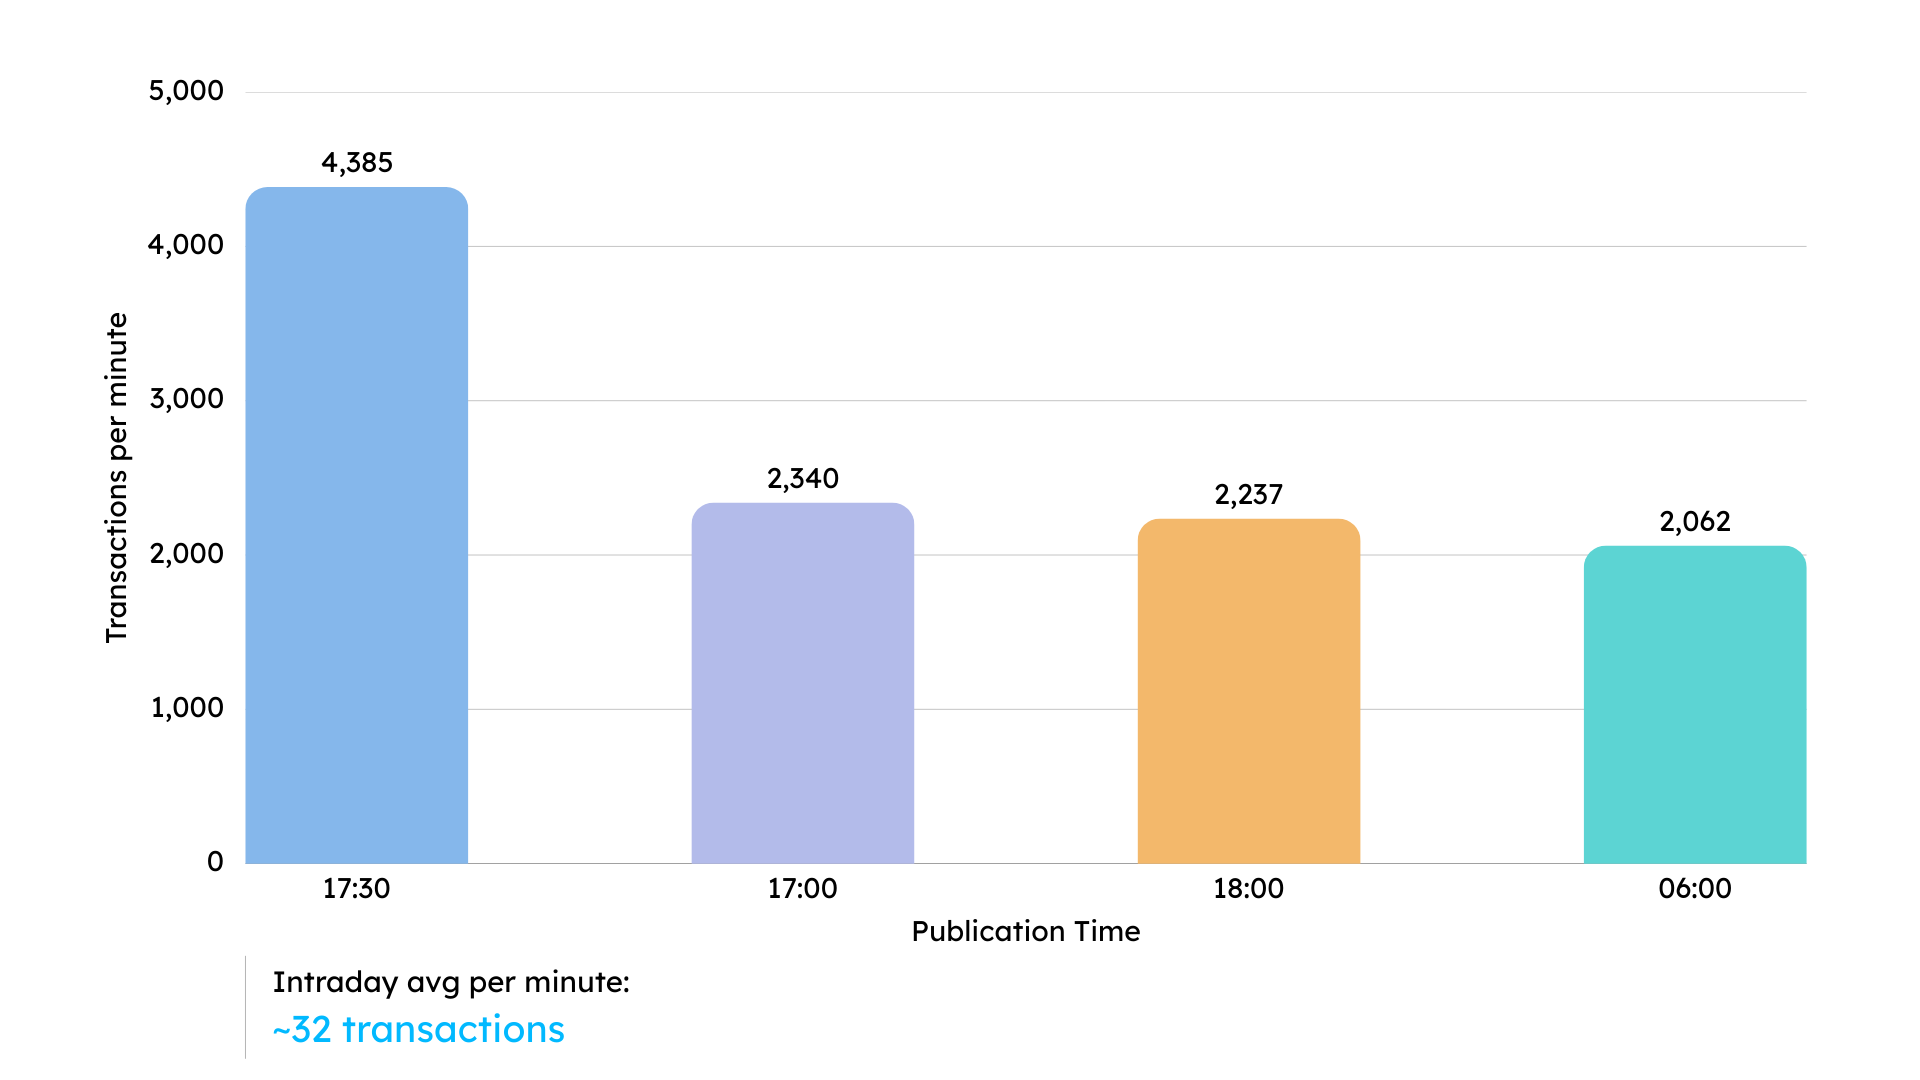
- The peak load is not distributed uniformly: it is concentrated at four specific minutes – 17:00, 17:30, 18:00, and 06:00 – that correspond directly to scheduled deferral releases and APA reopening events.
- The single busiest minute is 17:30, at approximately 9.5% of daily volume. Two structurally distinct high-load zones sit outside the core trading window: a regulatory release window between 17:00 and 18:59 driven by MiFID deferral bucket publications, and an APA reopening event at 06:00 driven by overnight-queued real-time transactions.
- Finally, the operating hours of contributing APAs – some running from 06:00 to 22:00 or continuously – are materially broader than the 08:00-17:00 window, and the publication profile is structurally determined by those upstream schedules.
These findings are preliminary but directionally important, and are expected to be confirmed over longer observation periods. They are presented as factual observations about the publication profile the CT will consolidate from June 2026.
The new UK bond transparency regime commenced on 1 December 2025. Under this regime, trading venues and APAs are required to publish bond transaction data in accordance with MiFID-derived transparency rules, including a structured framework of deferrals for large-in-scale and illiquid instrument transactions. Transaction data is published by each contributing venue or APA individually, in accordance with their own publication schedules and applicable deferral rules. The free 15-minute delayed feed made available by each venue and APA provides a publicly accessible record of this activity.
The UK bond Consolidated Tape is expected to go live in June 2026, operated by ETS Connect UK as designated CTP. The CT will consolidate the transaction data currently published individually by trading venues and APAs into a single continuous stream. The publication profile documented in this paper represents the upstream data the CT will be required to consolidate. Understanding it is directly relevant to assessing the operational demands that will be placed on the CT and the market participants depending on it from June 2026.
This paper analyses the intraday publication profile during the first two full weeks of the new regime, providing an empirical description of when transactions are published, in what volumes, and for what structural reasons. Any assessment of the CT's operational requirements should be grounded in the actual upstream publication profile rather than assumed usage patterns.
The analysis is based on the free 15-minute delayed bond transaction data published by 14 UK trading venues and APAs during 1 to 12 December 2025, made publicly available in accordance with MiFID transparency obligations. No proprietary, real-time, or confidential data has been used.
The delayed feed is published with a 15-minute lag relative to underlying transaction times. For this analysis – concerned with the publication profile rather than precise transaction timing – this is not material to the principal findings. The structural peaks at 17:00, 17:30, 18:00, and 06:00 are observable in the delayed feed with the same characteristics as the real-time feed, offset by 15 minutes. All publication times cited refer to the delayed feed. Corresponding real-time publication times are approximately 15 minutes earlier.
The 10 business days from 1 to 12 December 2025 were selected because this is the first period in which all four publication buckets – RT, T+1D, T+2W, and T+3M – were fully reported. Earlier periods would not capture the complete deferral profile: T+2W requires two weeks and T+3M requires three months of accumulated transactions before publication patterns stabilise. These findings should be treated as directionally important pending confirmation over a longer observation window.
Transactions are categorised across four publication buckets:
- Real-time (RT): Published without deferral, subject to applicable size and liquidity thresholds.
- T+1D: Deferred until the next business day – typically large-in-scale or illiquid instrument trades.
- T+2W: Subject to a two-week deferral.
- T+3M: Subject to a three-month deferral.
The primary metric is average daily transaction count by publication hour and minute across the 10-business-day period. Percentages represent each window's share of the average daily total across all buckets.
The observation period is limited to 10 business days and publication patterns may evolve as the regime matures. The analysis reflects the aggregate profile across all 14 contributors; individual venue and APA profiles will vary. The 15-minute delay means intra-minute timing precision is approximate, though structural findings on publication windows and peak hours are not affected. The contribution breadth across venues and APAs is discussed further in Appendix A.
Approximately 34.1% of average daily transactions are published outside 08:00-16:59. The 17:00-17:59 hour is the single busiest of the trading day at approximately 16.6% of daily volume – more than any individual hour within the core window. Figure 1 illustrates the hourly distribution across the full trading day.
The 17:30 minute alone accounts for approximately 9.5% of all daily transactions – the highest throughput of any single minute. The three largest per-minute peaks across the entire day all occur after 17:00; the fourth occurs at 06:00. Figure 2 illustrates the minute-level spike profile across the four peak windows.
The concentration at specific minutes reflects the operation of the UK MiFID deferral framework and APA publication schedules – not anomalous activity.
Under the UK MiFID framework, transactions qualifying for deferral are published in bulk at pre-determined times. The three deferral buckets release at different points:
- T+1D transactions release at approximately 17:00 in the delayed feed (16:45 real-time). These represent the most recent trading activity for which disclosure was withheld overnight.
- T+2W transactions release at approximately 17:30 (17:15 real-time).
- T+3M transactions release at approximately 18:00 (17:45 real-time).
These scheduled releases produce the sharp, predictable peaks at 17:00, 17:30, and 18:00. They are a consequence of the regulatory deferral framework, not of any design choice by individual venues, APAs, or the forthcoming CTP.
Certain APAs hold real-time transactions executed between approximately 22:00 and 06:00 – outside their operating windows – and release them in bulk at 06:00 on reopening. These are not deferred transactions in the MiFID sense; they are real-time transactions queued pending system reopening. The result is a concentrated release at 06:00 (05:45 real-time), producing the fourth-largest per-minute peak of the day.
The 06:00-07:59 period accounts for approximately 9.4% of average daily transactions, driven primarily by the bulk release of overnight-queued real-time transactions at 06:00. Activity during 07:00-07:59 is lower but sustained as venues and APAs reach full capacity ahead of the main trading day.
The 17:00-18:59 window accounts for approximately 22.5% of all daily transactions – the most transaction-intensive period outside the core window. The 17:00–17:59 hour is the single busiest of the entire trading day.
T+1D carries particular significance for institutional CT users. These transactions represent the most recent activity for which disclosure was withheld overnight, and their publication at or around 17:00 is the first moment at which the market receives a complete picture of the previous business day's deferred bond trading. For asset managers, banks, trading desks, and compliance functions, T+1D data supports end-of-day and next-morning position valuations, best execution monitoring, regulatory reporting workflows, and market risk model recalibration. The 17:00-18:00 window is therefore not merely a high-throughput event – it is the point at which a significant body of market data unavailable during the trading day first becomes publicly accessible.
The publication profile documented in this paper is not a reflection of when bond trading activity is highest. It is a reflection of when transparency obligations require that activity to be disclosed. The distribution of trading activity across the day and the distribution of publication events are materially different: real-time transactions are published continuously during trading hours, while deferred transactions – representing a significant share of daily volume – are released in concentrated bursts at times determined by the MiFID deferral framework. The CT will consolidate publication events, not merely real-time trading activity, and its operational characteristics will reflect both.
This paper has presented an empirical analysis of the intraday publication profile of bond transaction data during the first two weeks of the new UK transparency regime. The publication cycle is characterised by two structurally distinct high-load zones outside the 08:00-17:00 window – an early ramp-up from 06:00 to 08:00, and an end-of-day peak from 17:00 to 18:59 – that together account for approximately one third of all daily transactions. These patterns are predictable and structural, driven by the MiFID deferral framework and APA operating schedules, and can be expected to recur on every business day for as long as the current deferral architecture remains in place.
These findings are preliminary but directionally important. They will benefit from confirmation over a longer observation period as the transparency regime matures.
As the UK Bond Consolidated Tape prepares to go live in June 2026, any assessment of its operational framework – including infrastructure capacity, service levels, and support coverage – should be grounded in the actual upstream publication profile documented here, rather than assumptions about daytime-only usage patterns.
The publication profile observed in the first two weeks of the regime is not an incidental feature of market behaviour but a structural consequence of the MiFID deferral framework and APA operating schedules. The Consolidated Tape will therefore inherit a data stream characterised by concentrated publication events outside the core trading window, particularly at 06:00 and between 17:00 and 18:59. Any operational design, service level framework, or licensing model for the CT should be assessed against this structural publication profile rather than assumptions based solely on intraday trading activity.
The data is drawn from the publicly available 15-minute delayed feed, and the methodology is described in full in Section 2. The authors welcome any questions regarding the analysis or the underlying data.
The aggregate publication profile presented in this paper is derived from data across 14 contributing trading venues and APAs. The peaks identified at 17:30, 17:00, 18:00, and 06:00 are observable across multiple contributors, not driven by concentration in a single venue or APA. The 17:00-18:59 end-of-day peaks in particular reflect the operation of the MiFID deferral framework, which applies uniformly to all contributing venues and APAs regardless of size or market share. The 06:00 peak is attributable to APAs that operate on extended schedules and queue overnight real-time transactions for bulk release on reopening; this behaviour is observed across more than one contributing APA. Detailed venue-level and APA-level breakdowns are available from the authors on request.
This paper is published for information and discussion purposes only. It does not constitute legal, regulatory, or commercial advice. The analysis is based on publicly available 15-minute delayed data and the authors make no representation as to its completeness or accuracy beyond the observation period described.
Propellant Digital is an award-winning technology company specialising in Fixed Income data analytics. Our founders are trusted specialists in transparency and trading data, passionate about making bond, swap and ETF markets more transparent.
Propellant Digital delivers practical, responsive technology that transforms this data into actionable insights. We help global and regional banks, asset managers, quant hedge funds, trading venues, regulators, and industry associations to analyse transparency and trading data in near real-time. Our unique analytics cloud platform leverages the most extensive Fixed Income dataset, providing users with the insights they need to improve trading strategies, streamline workflows, and make informed trading decisions.
propellant.digital | info@propellant.digital
Keizersgracht 520H, 1017EK Amsterdam, Netherlands

.png)
.png)
.png)