
%20(11).png)
In the US, FINRA’s TRACE has been around since 20021 and Europe has been playing catchup with regards to Fixed Income transparency since. European markets now have not only transparency data, but real-time consolidated tapes emerging across multiple asset classes, will the European market now cover multiple time zones?


Firstly we want to look at how trades are distributed throughout the European day, so we plot the average number of prints per hour, split by jurisdiction (i.e. UK or EU MiFID).

Chart 1 above shows us the distribution of trades split by currency and we can see that whilst the 3 main currencies (EUR, GBP and USD) peak in the ‘core’ hours between 07:00 and 18:00, the tail is almost entirely comprised of USD activity (traded during US and Asia-Pacific timezones).
Nothing about this chart is likely to come as a surprise. It is completely logical to see the bulk of GBP and EUR activity in the middle of the distribution, and for USD to be spread more widely given its global presence and the shift towards a 24/5 world in US equity trading2.
Next we want to consider, what proportion of activity is reported in real-time by hour (some deferred trades could be reported after the European close and this is likely to be less meaningful for participants than intraday activity).
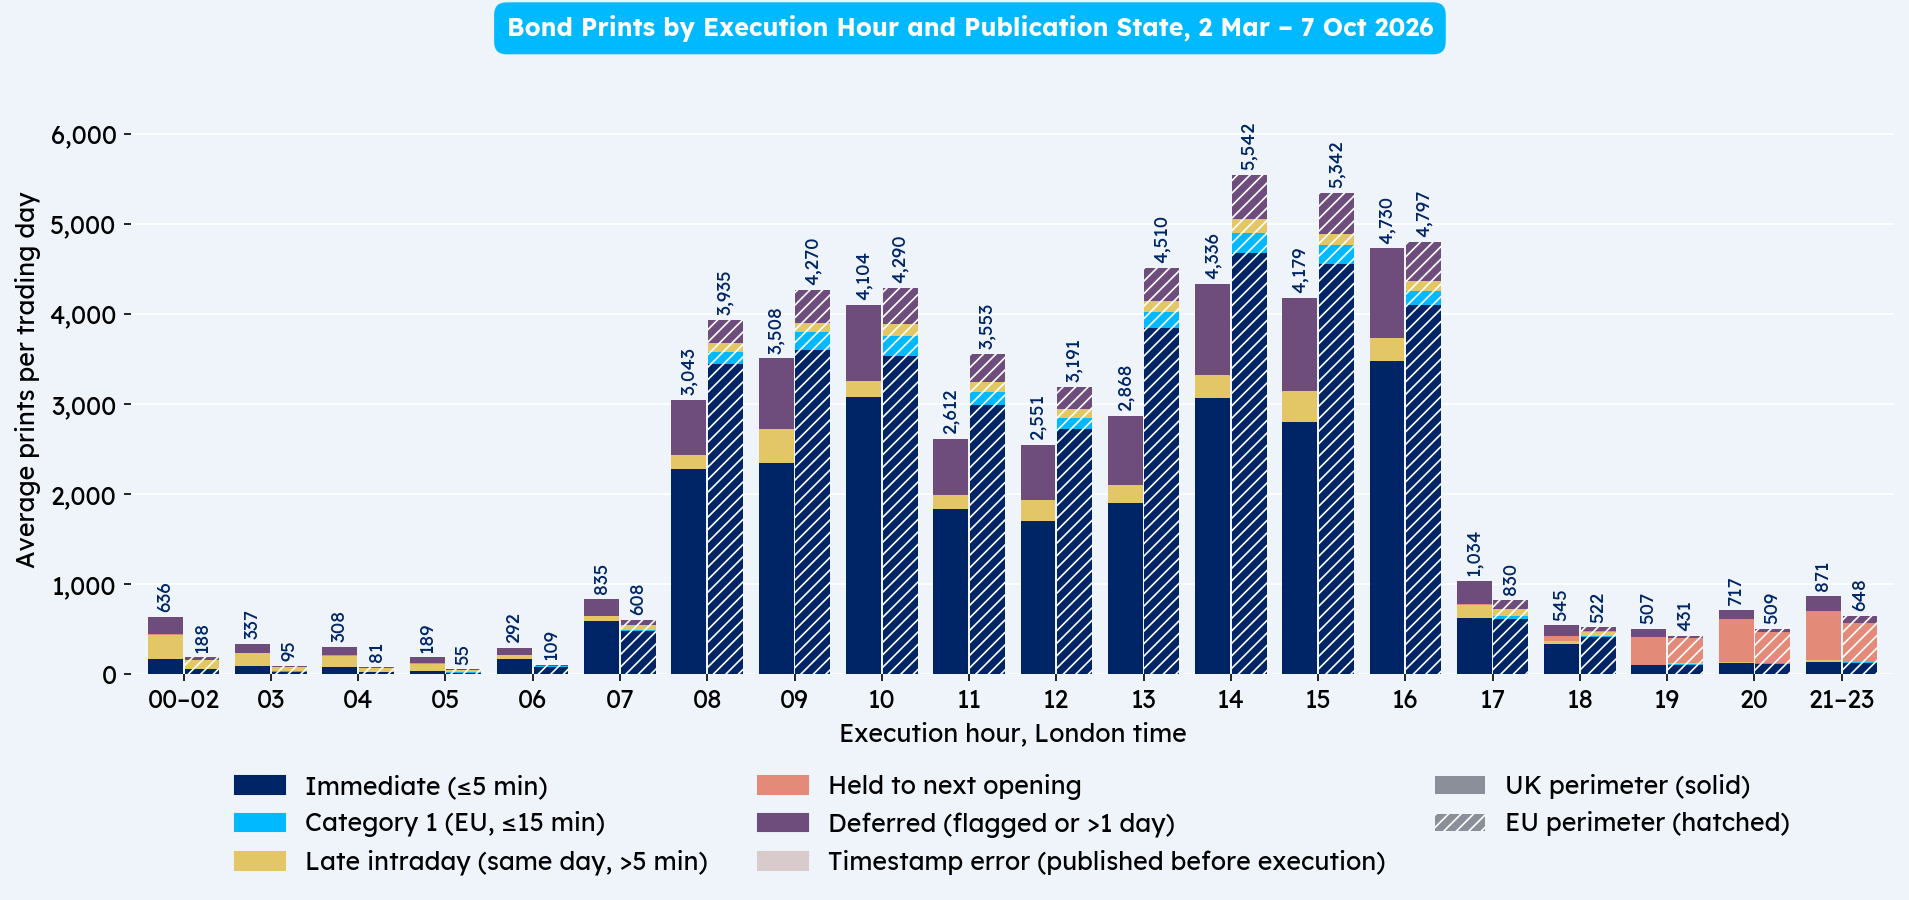
We can see that the real-time distribution follows a similar pattern, with the vast majority of activity reported between 07:00 and 19:00 and very little outside that window.
As with Chart 1 this isn’t totally unexpected, however it is interesting to note that outside the core window it is likely to be USD activity (including US Treasuries), so it is perhaps a small surprise that there isn’t more real-time activity.
“Only 3.3% of real-time prints occur between 18:00 and 06:00 London time, almost exclusively in US dollars, meaning what a European trader actually sees in real-time overnight is only a fraction of the volume going through, as most of those prints are held over until the next European opening.”

So far we have looked across all bonds and seen the deferral times (i.e. how quickly a trade is reported) throughout the day, but we have not yet looked at the distribution by type of bond (i.e. explored the possibility there is a difference between rates and credit flows), therefore we will do that now.
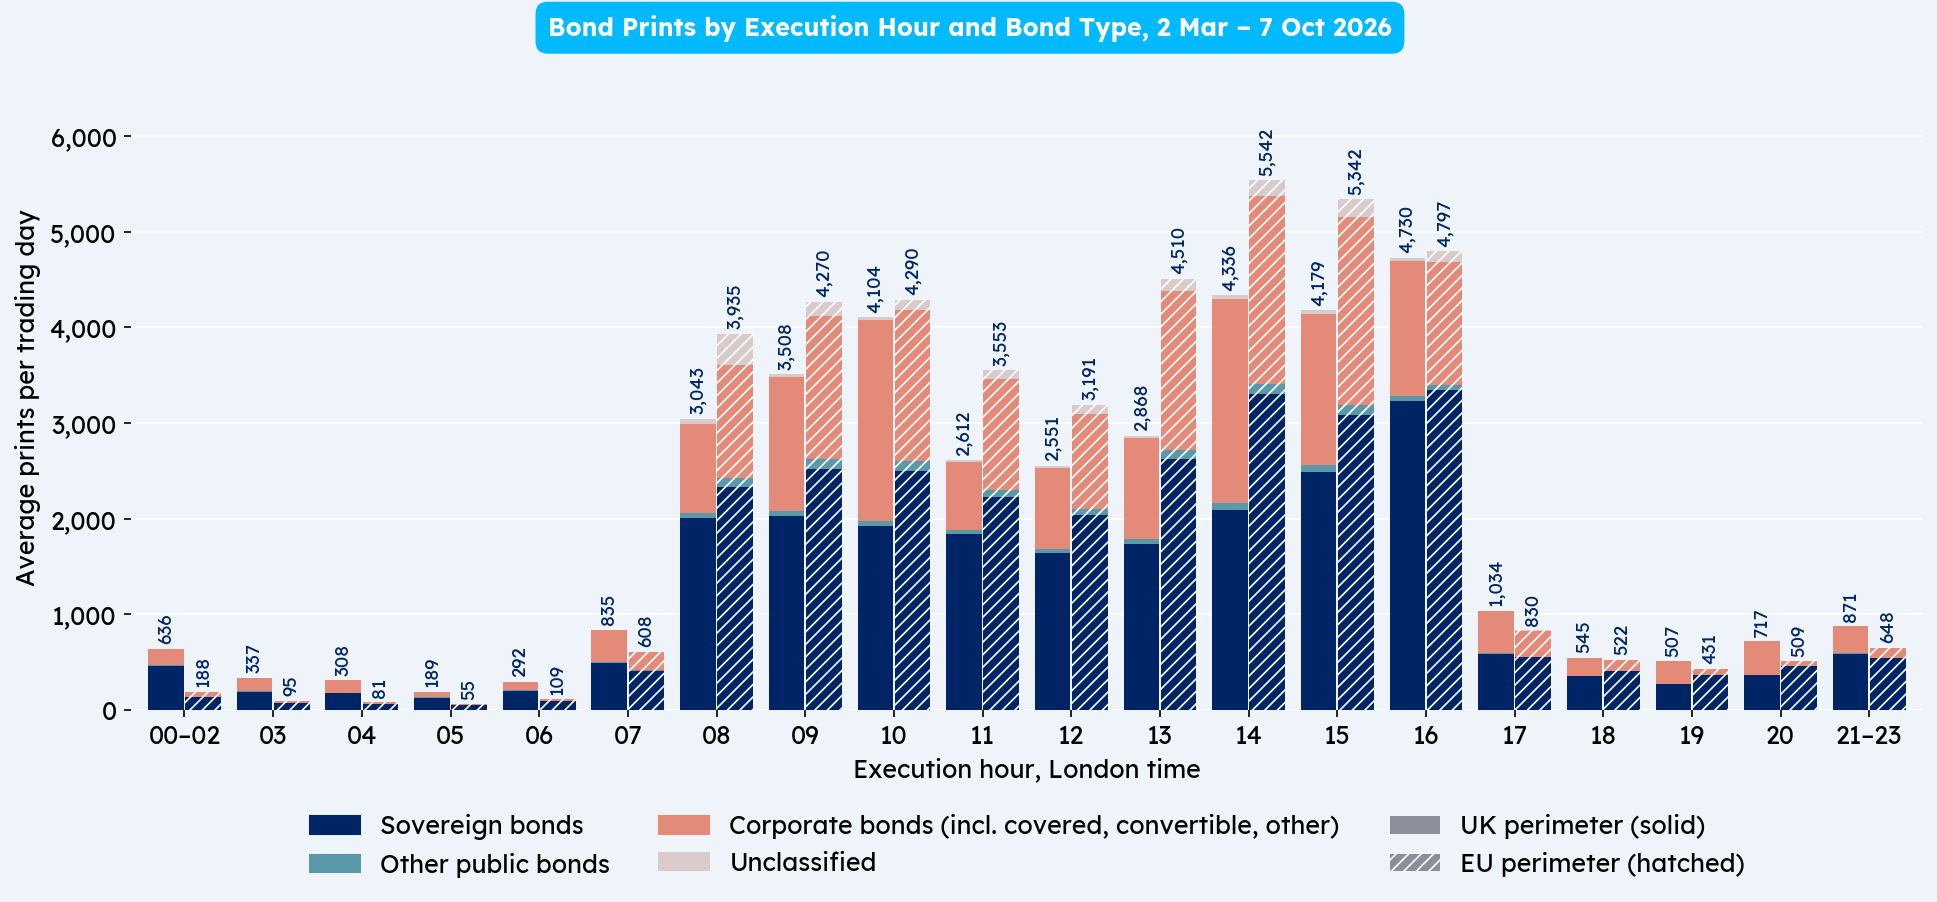
From Chart 3 we can observe that in line with expectations, the majority of credit and rates activity (i.e. sovereign and non-sovereign bonds) is concentrated between 07:00 and 18:00.
It is arguably surprising as to how much non-sovereign activity there is in relation to government bonds traded, however it is important to note that this includes not just vanilla corporate bonds, but also covered and convertibles (as well as other more niche categories).
“Seeing how much flow occurs on non-sovereign bonds was a bit of an eye-opener, however when you consider the vast number of instrument types, particularly highly liquid sub-sovereign and covered bond issuers it begins to make more sense.”
It is important to drill down into the overnight reporting and see how it is broken down (so that we can evaluate the makeup of the trade reports).
We start by looking at the reports through a deferral lens (i.e. whether the trade was reported in real-time or not).
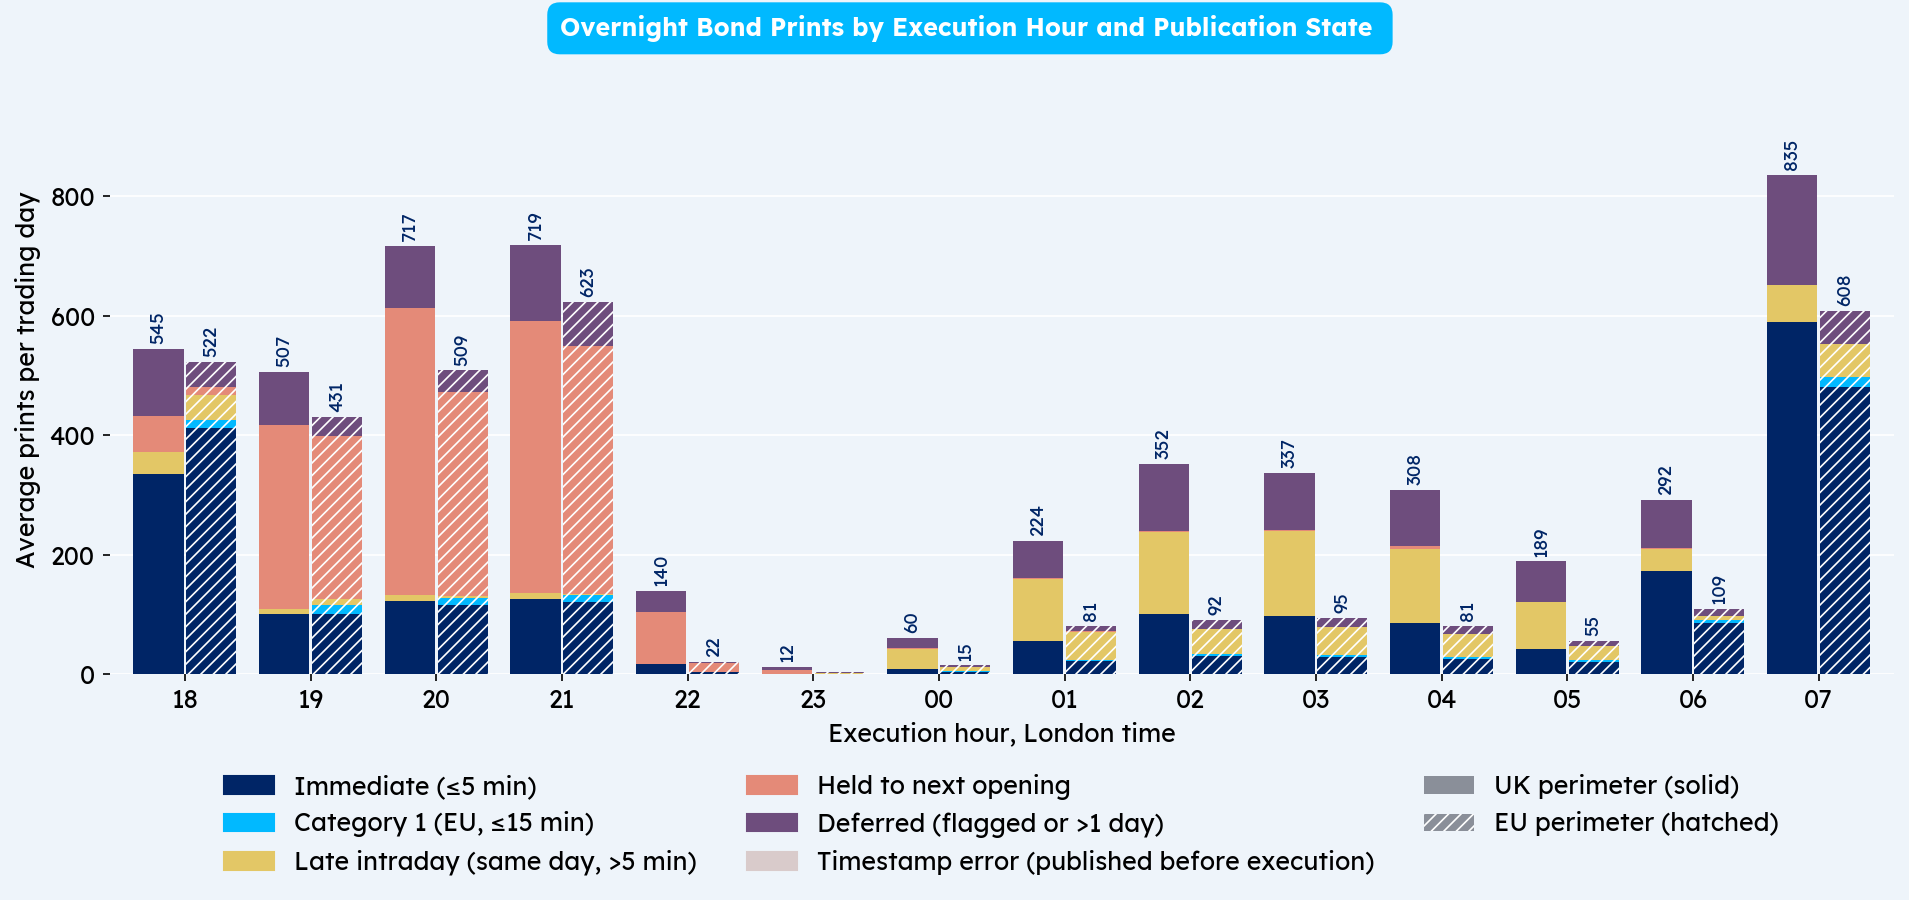
When diving into the overnight activity, we can see that a significant chunk is actually reported the next day (i.e. not in true real-time). This can be for 1 of 2 main reasons. Firstly, it could genuinely be reported late or secondly (and more commonly) it could be reported, but not publicly disseminated because the APA was not operating overnight (not all APAs operate on a 24/5 basis), this accounts for approximately 33% of overnight prints.
Whilst there is some real-time activity, it is only really material between 18:00 to 19:00 and 06:00 to 08:00.
Finally we take a look at overnight reporting, considering the type of bond. We can see the split is proportionally very similar to that shown in Chart 3 (i.e. between credit and rates).
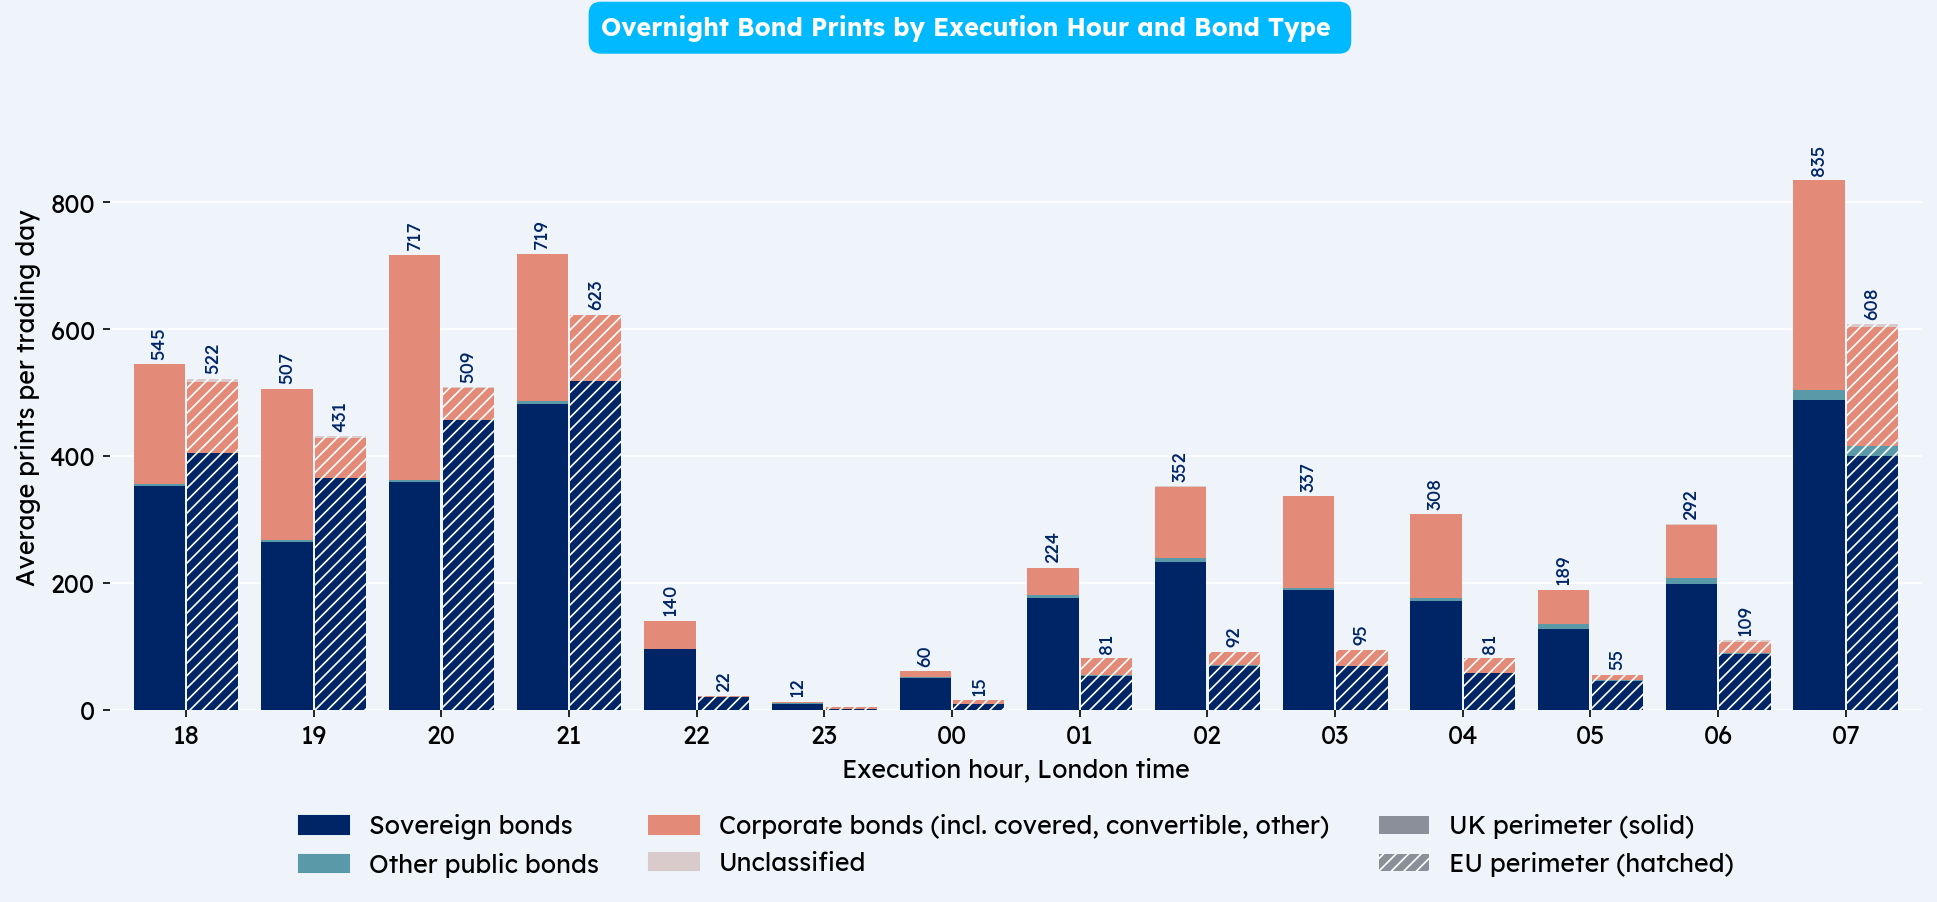
Chart 5 highlights that the breakdown of trade reports is in line with that seen throughout the day and does not suggest anything changes with regards to the relative split between credit and rates overnight.
“The vast majority of activity captured via MiFID is reported between 07:00 and 18:00, this is particularly the case with real-time reports.
Whilst some real-time MiFID activity occurs overnight, as mostly USD, this is likely to be captured via TRACE (which we looked at in Insights 51). The rest will often not be disseminated until the European morning.”

1https://www.finra.org/media-center/blog/trace-at-20-reflecting-advances-transparency-fixed-income
2https://uk.finance.yahoo.com/news/nasdaq-plans-nearly-23-hour-211008903.html
Vidal Mehra - Vidal is Chief Product Officer for Propellant Digital and the lead author for Propellant Insights.
He has been working with financial institutions for over 20 years across multiple disciplines including front office and consulting roles.
Helena Roughton - Helena recently joined the team as a Product Manager, bringing extensive MiFID policy experience having previously worked at AFME.
She also brings product remediation and data analysis experience from the Bank of New Zealand.

%20(10).png)
%20(9).png)