
When considering volumes on Sovereign debt in the Asia-Pacific (APAC) region, Japan (a G7 nation and active issuer) is likely the first name that comes to mind.
Fairly uniquely for the region, Japan issues debt almost exclusively denominated in its own currency, Japanese Yen (JPY), so when we consider volumes in USD or EUR it is a notable absentee from the chart below showing volumes reported under MiFID.
Japan of course is not the only nation with limited (or no) outstanding debt in USD and EUR, both Australia and New Zealand show no activity, other than in local currency.
In Fixed Income, the term ‘Hard Currency’ has an imprecise definition. Broadly speaking, it refers to a widely traded and stable (global) currency1, which by some definitions would include both Japanese Yen and Australian Dollars. However, particular for credit traders, hard currency is often short hand for EUR or USD (and occasionally GBP, although that is possibly due to regional bias)!
Chart 1 below shows EUR equivalent volumes reported under MiFID for EUR- and USD- denominated bonds and is not likely to present any revelations for EM traders. However for those who follow the region less closely, it may be surprising to see the increasing presence of EUR denominated debt (and perhaps some of the leading USD issuers).
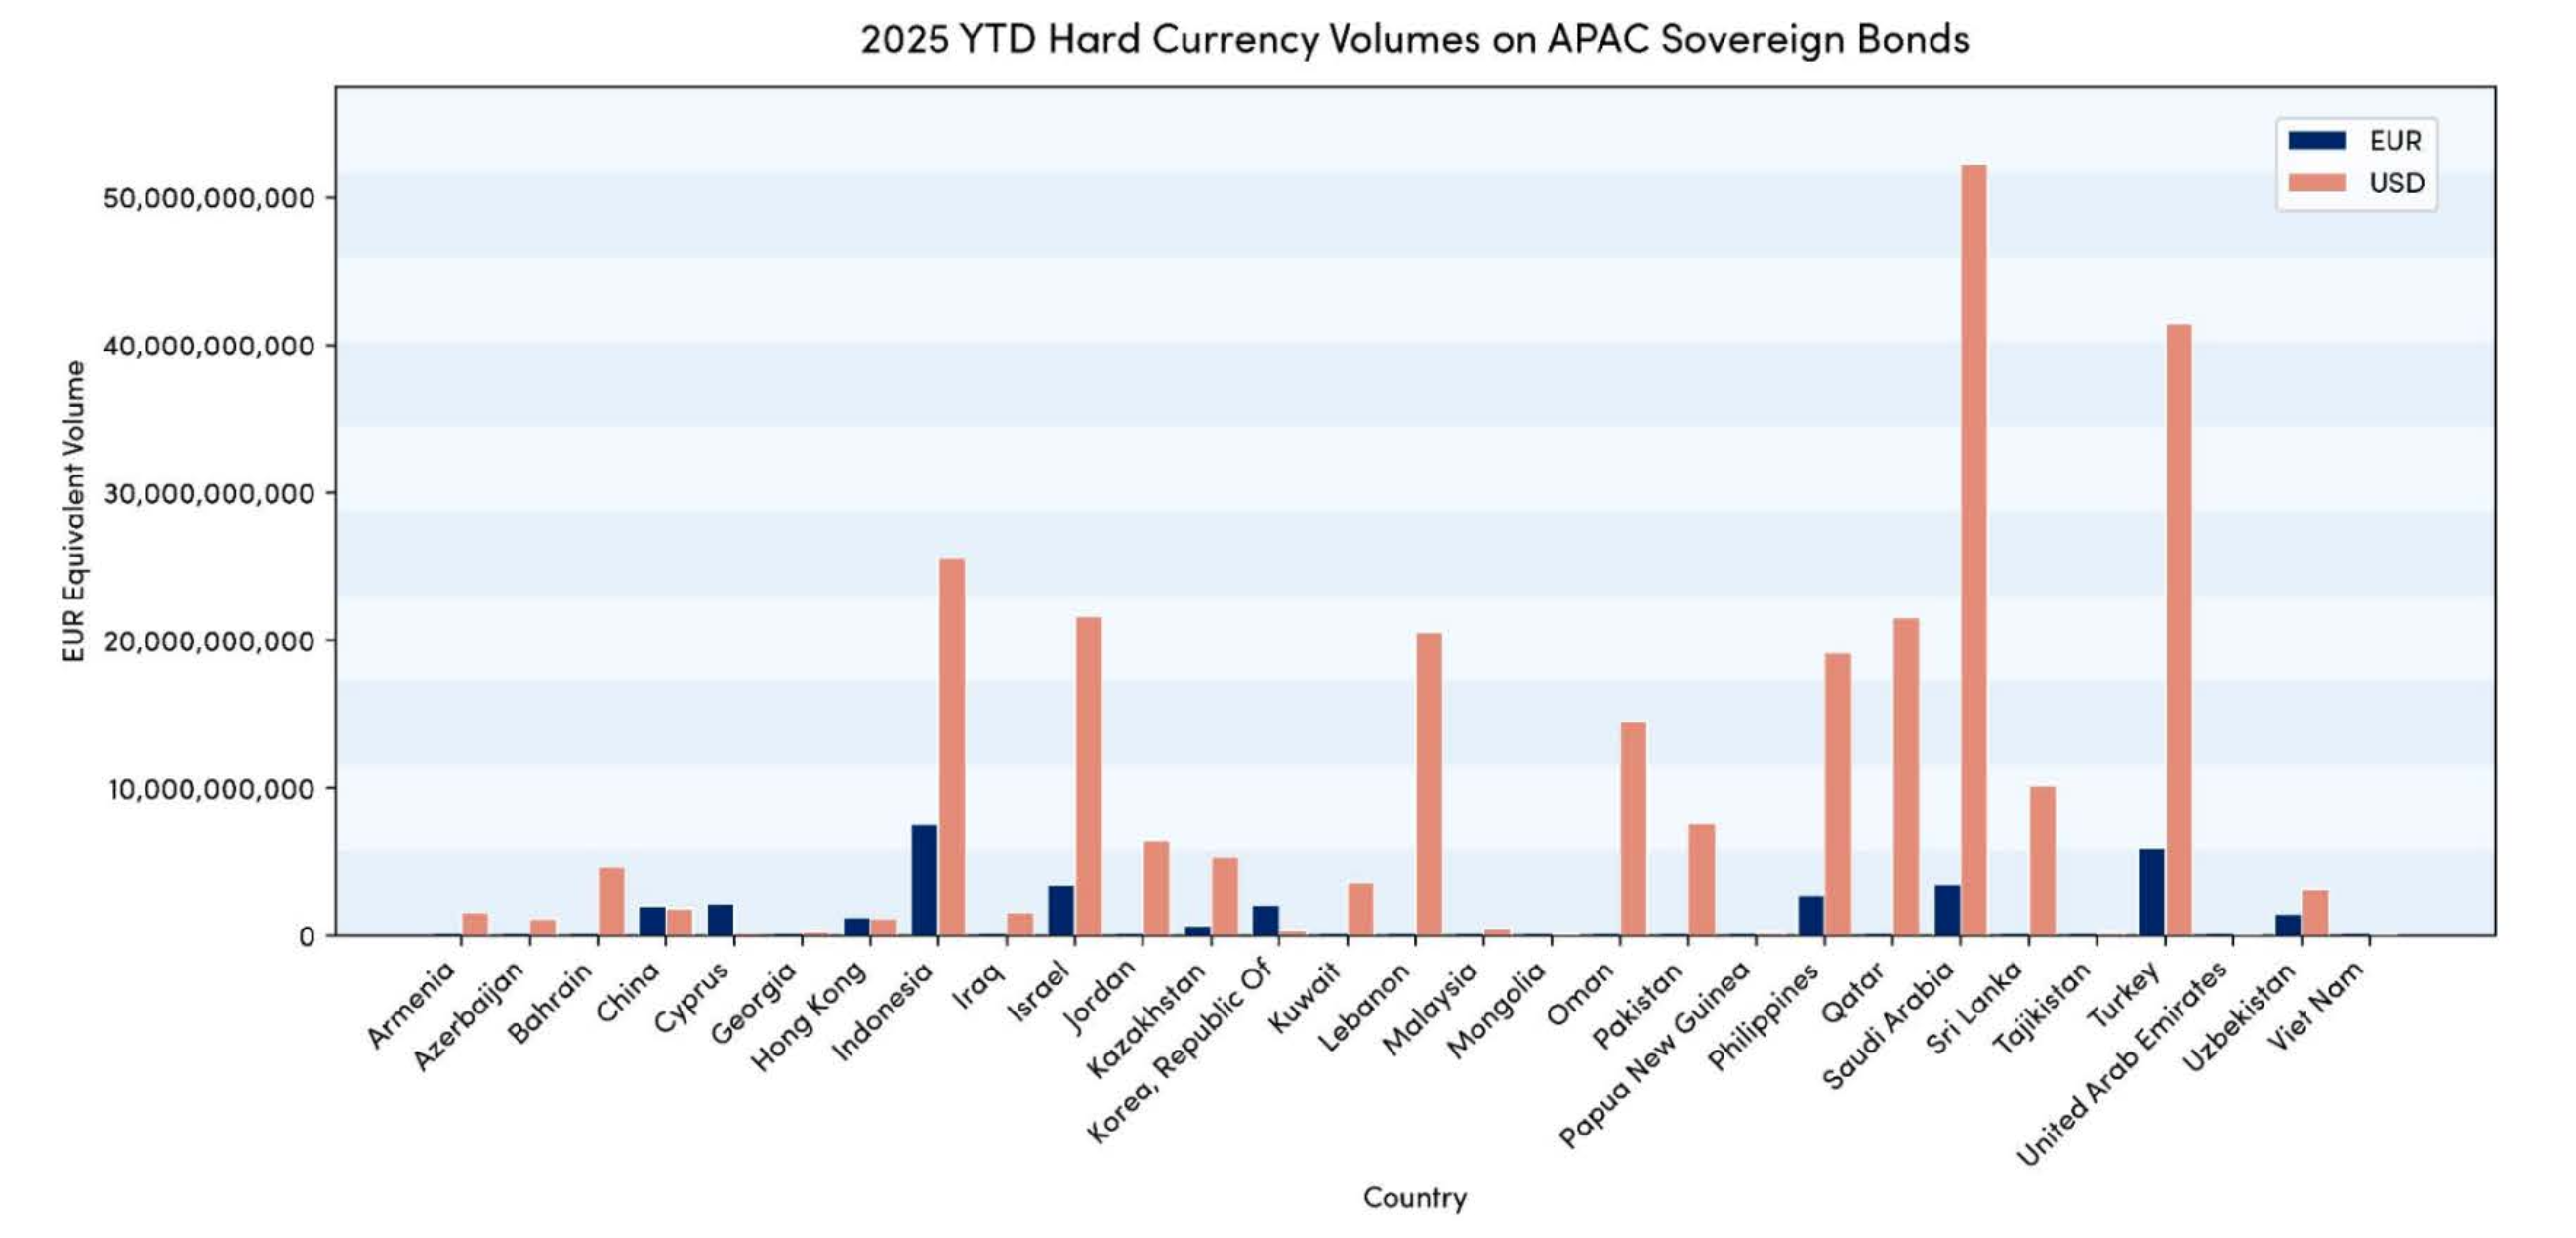
As noted in the previous section, hard currency debt within the Asia-Pacific region has sizeable flows, particularly from some issuers, such as Saudi Arabia and Turkey, however what this overlooks is the amount of debt reported under MiFID in local currencies.
Chart 2 below shows the year to date breakdown of (EUR equivalent) volumes, considering all sovereign debt issued within the APAC region (i.e. not just debt denominated in EUR and USD).
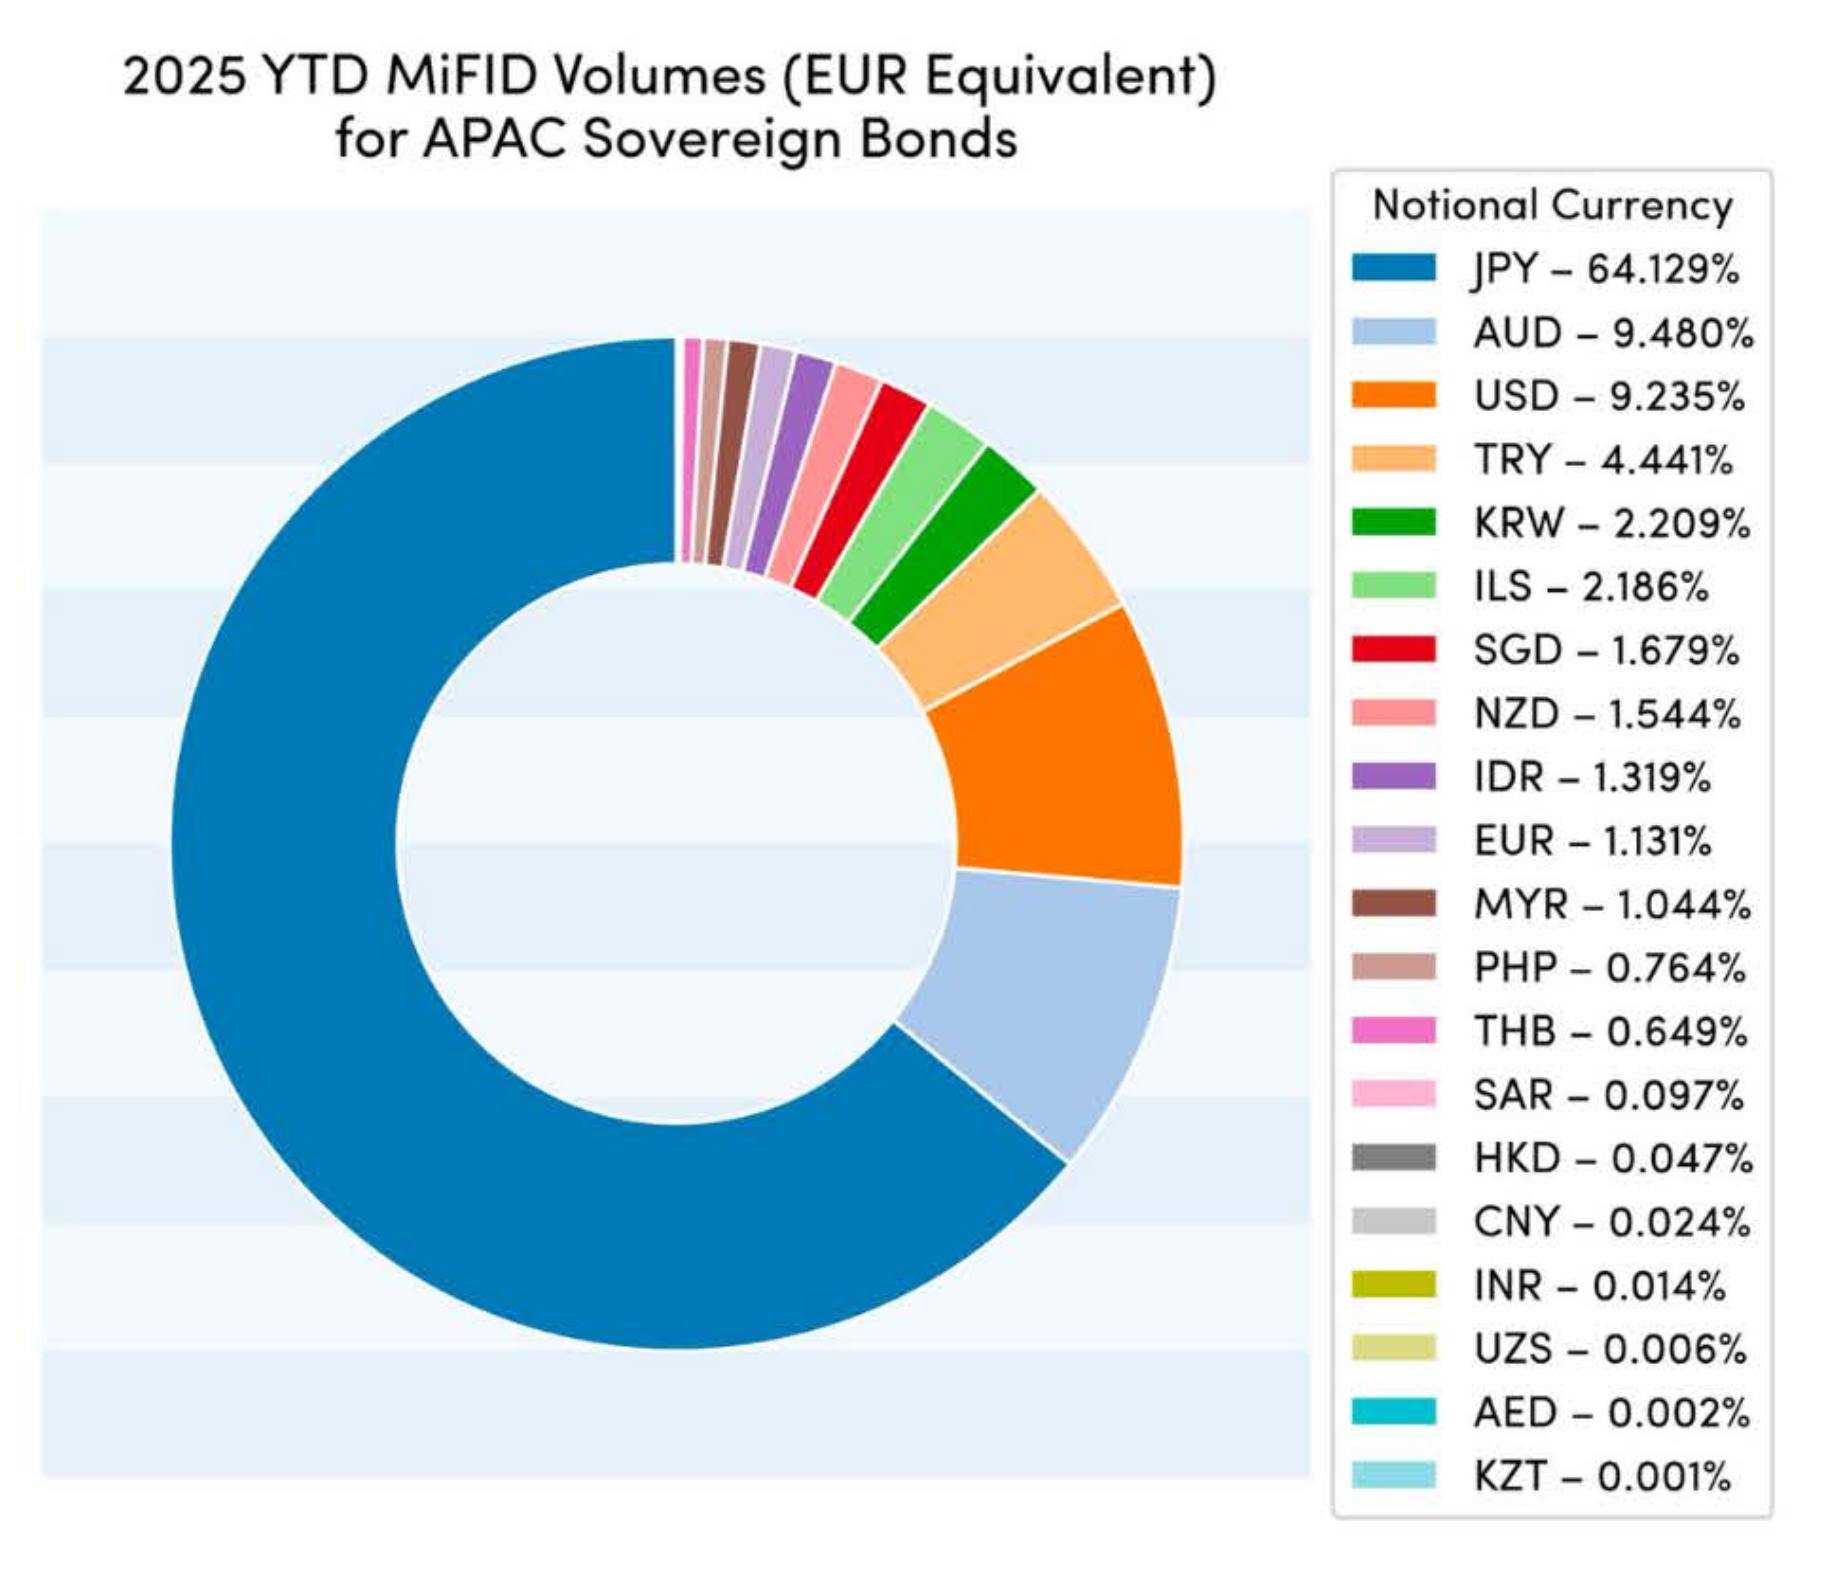
It is clear that the largest issuer in the region (by a large margin) was Japan. To be more precise, what this actually highlights is debt issued in Japanese Yen was the most actively traded. Whilst this is almost exclusively issued by the Japanese government, other countries do issue bonds denominated in JPY.
Japanese Yen being the most active currency is fully expected, but perhaps less so is the fact that the Australian Dollar (AUD) is the second most active, narrowly edging out USD.
The next notable call out is that EUR debt makes up a relatively small percentage of the volumes at just over 1%.
From the data, it is apparent that a considerable amount of flow on Asia-Pacific sovereign debt is reported under MiFID. This is very positive news, not just for EM traders, but also for issuers looking to reach European investors and (local or hard currency) traders looking for transparency in new markets.
As with debt issued by EU sovereigns, APAC bonds will also benefit from enhanced transparency, with aggregation removed by the FCA from 1st December 2025 onwards and increased real-time reporting (where a trade is executed on an FCA venue or with an FCA regulated entity).
ESMA’s equivalent regime will begin on 2nd March 2026 and, as with the FCA regime, is expected to result in far more APAC bond transactions reported in real-time.
It is generally accepted that around 60% of Sovereign debt transactions reported under MiFID are disseminated in real time. The monthly volumes in Chart 3 reveal the breakdown between real-time and non-real-time reported trades on APAC Sovereign debt.
It may not come as a huge surprise that the real-time numbers appear low, given that intuitively more European debt is likely to be traded and reported under MiFID, however it is important to acknowledge that although 60% of trades may be reported in real-time this does not necessarily translate to volume.
It is likely the percentage of volume reported in real-time is lower than the percentage of trade tickets as the larger trades are aggregated and/or deferred.
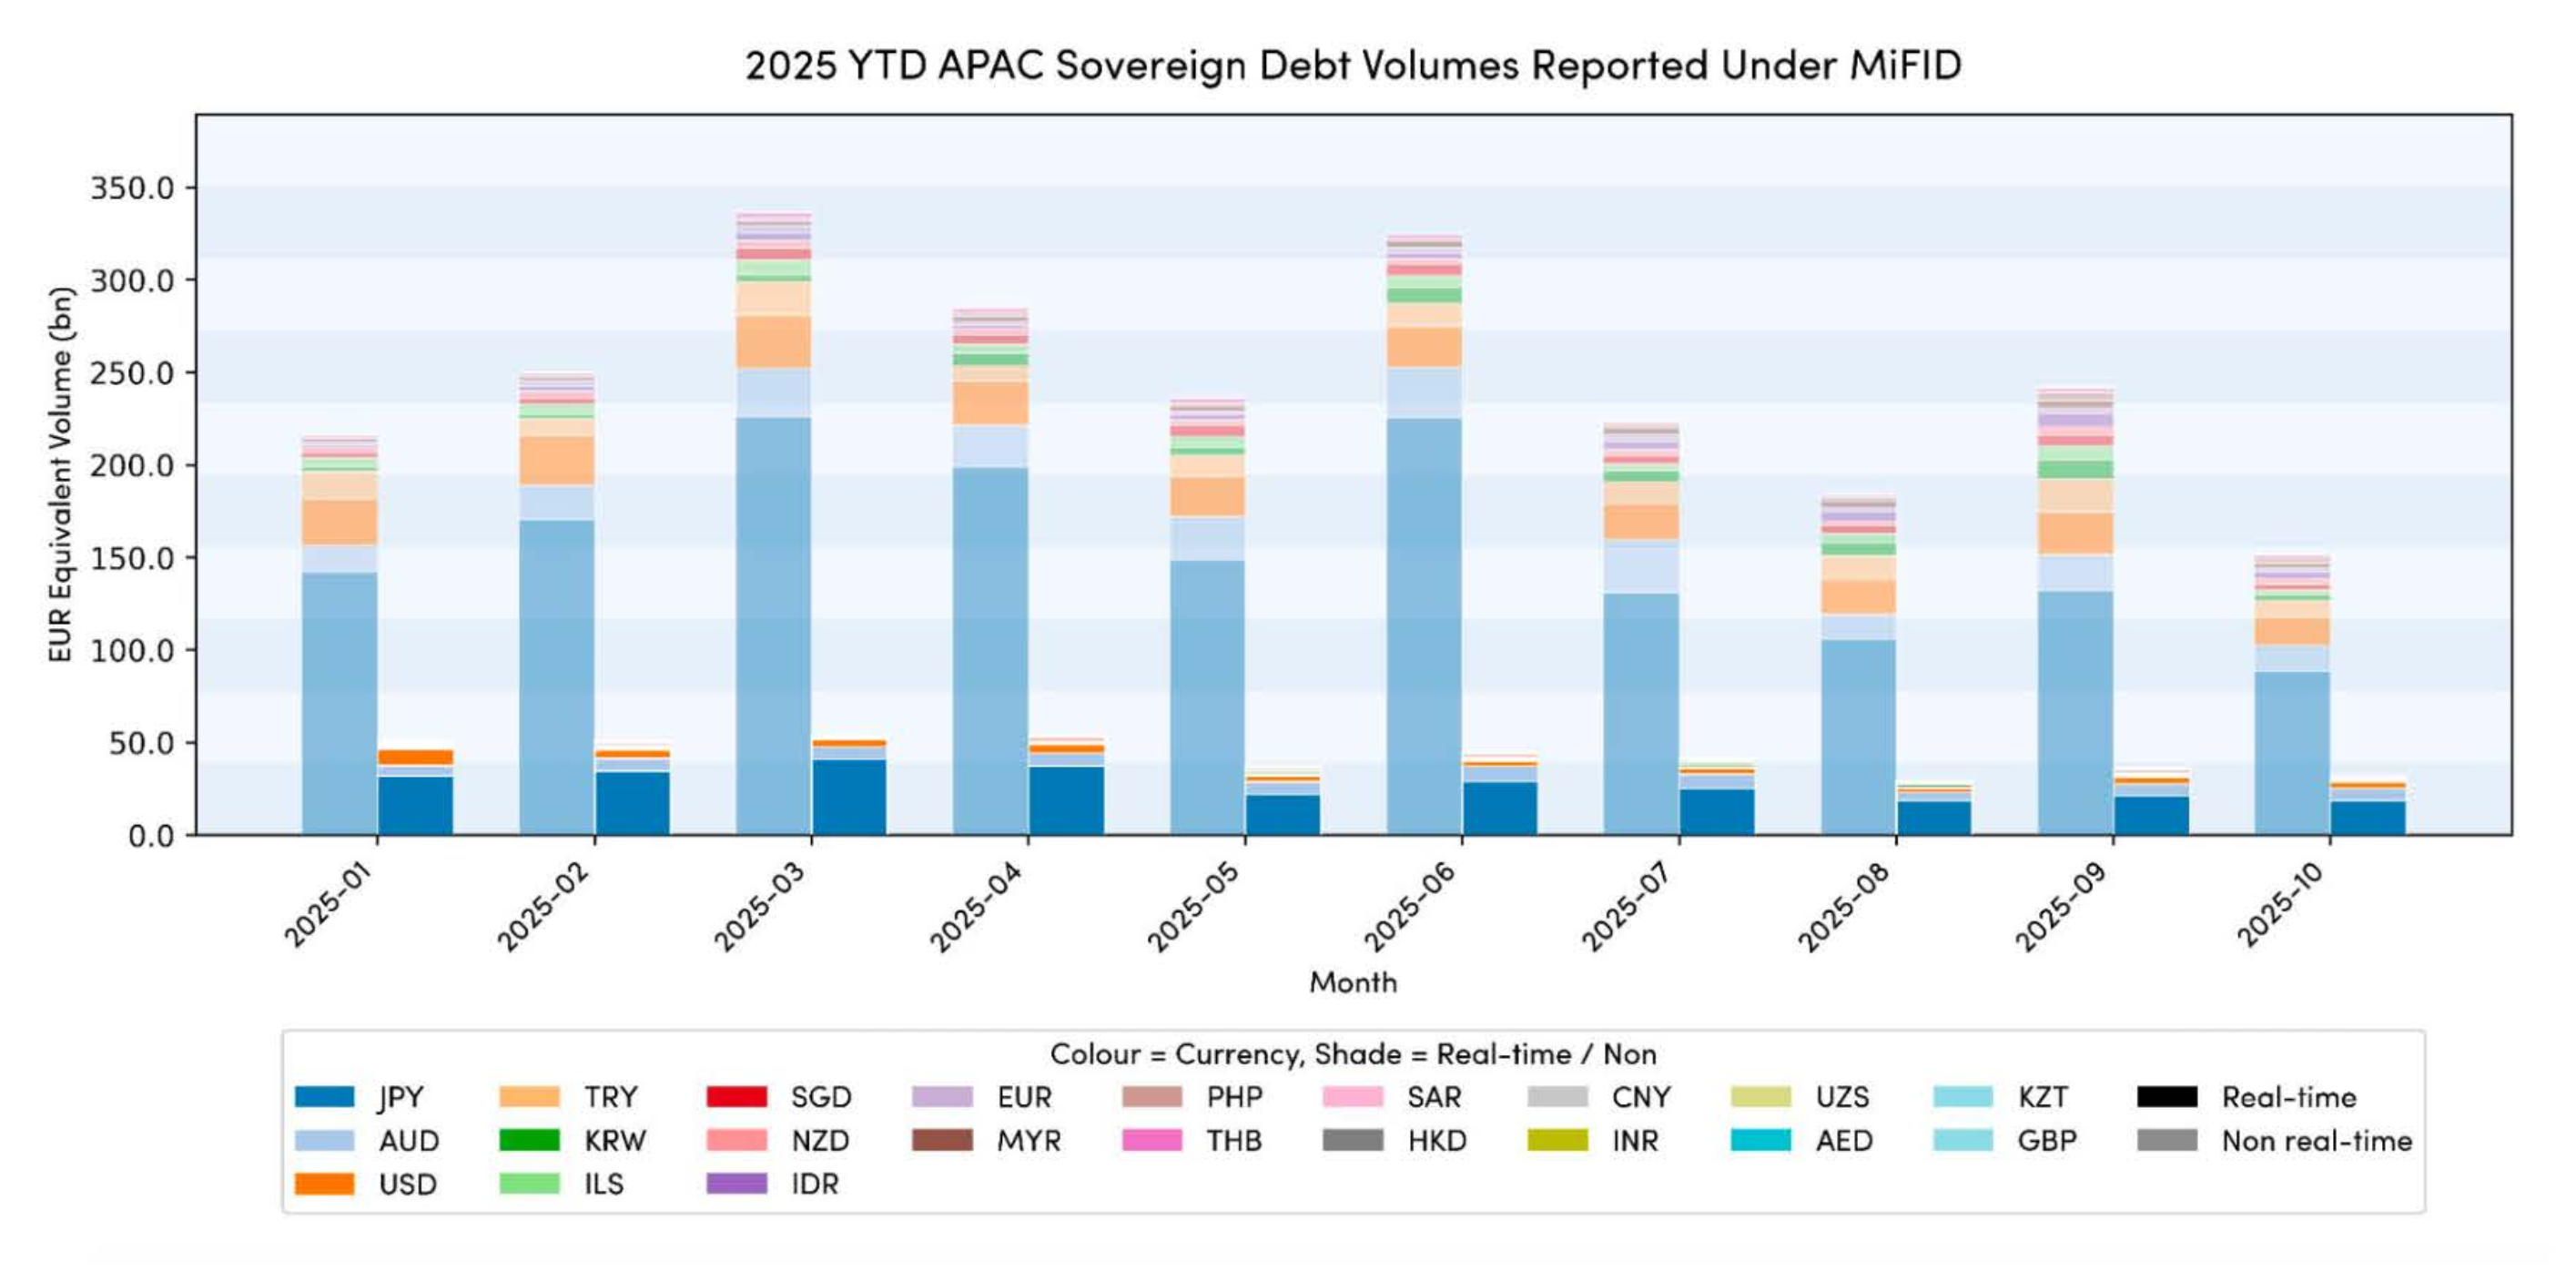
It may actually be more surprising to some, that such a high percentage of activity is reported in real-time, although it should be noted that this is almost exclusively in Japanese Yen (JPY), Australian Dollars (AUD) and of course US Dollars (USD).
Predicting how this changes with the new transparency regime is tricky, however numbers as high as 96%2 have been cited (again this relates to transaction count, volumes will be lower) across all Sovereign debt reported under MiFID.
The good news is that the wait is nearly over and in a matter of days the speculation can stop and the analysis can begin!
1https://www.investopedia.com/terms/h/hardcurrency.asp
2https://www.ft.com/content/2a43670c-967d-44be-80cc-6671b0c90c00?shareType=nongift