


One of the first things you typically get taught, when learning about bonds is that they have a coupon and a maturity date. As you learn more, you quickly discover that not only do zero-coupon bonds exist, but also perpetual bonds (that have no final maturity date).
It might seem odd to issue a bond that pays a coupon indefinitely, but most perpetual bonds are callable after a specific term (generally 5 years), so in reality the issuer has the right to redeem the bonds at that point.
Type of Perpetuals
In Europe, since the global financial crisis, the issuance of perpetual debt has been fairly consistent between the types of institutions.
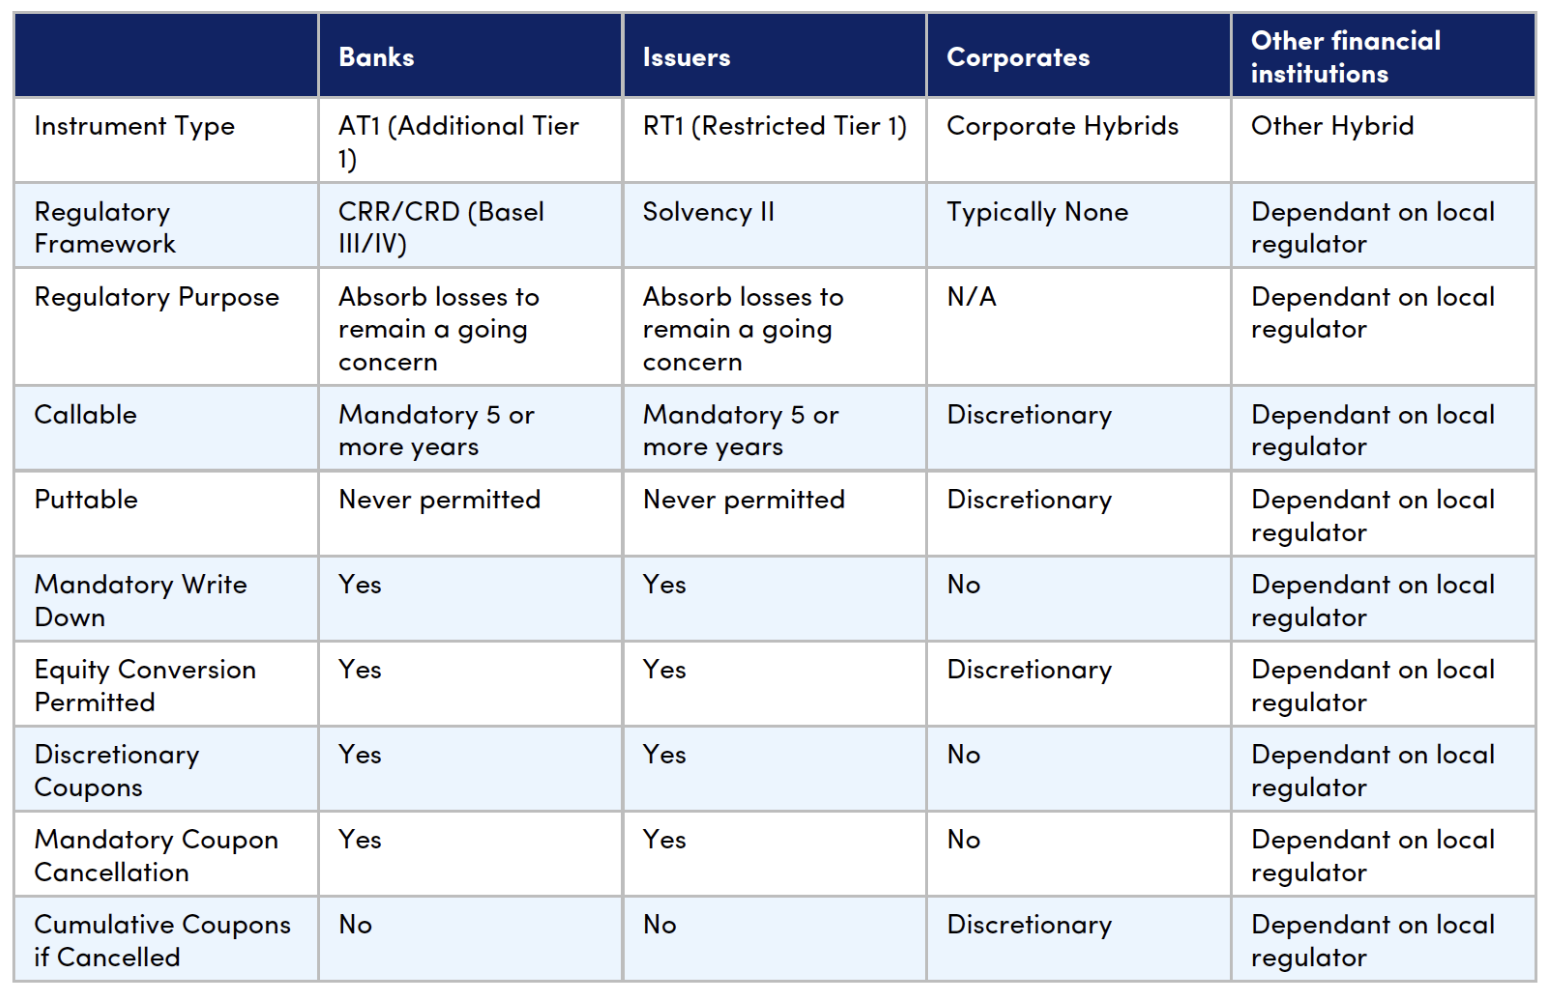
The regulatory rationale and requirements differ, however the characteristics are broadly similar (i.e. they all fall under the same high level categorisation of ‘hybrid’ instruments that sit between debt and equity, have no final maturity but instead have the option to put or call the security). Table 1 shows the characteristics of the different instrument types.
Activity Reported Under MiFID
As a former Sub Financials trader, when researching this article I had to keep reminding myself that bonds maturing in 2049 were not actually perps (something that if you have ever traded bank capital you may sympathise with). To explain, 2049 was commonly used as the default perpetual bond maturity for a number of years, however it is not quite so far away now and is no longer suitable (as even long dated bullet bonds can be longer than 25 years). It may be intuitive to think that flows on bank capital would outweigh those on corporate hybrids, however the data below tells a different story (see Chart 1).

The data shows that EUR equivalent volumes each month are actually larger for non-bank perps. Whilst this might be surprising, it becomes more understandable when considering this includes Solvency II compliant insurance debt, non-bank financial perps and corporate hybrids.
Familiar names, including Axa, Aviva and Nationwide, show in the non-bank category along with active corporate hybrid issuers such as Total and Telefonica. On the bank side, the data contains activity across the traditional names as well as a small number of less frequent issuers and smaller entities. In both categories, EUR-denominated debt unsurprisingly makes up the bulk of the activity.
Getting into the Detail
When we look at a single day (we consider the last day of September - see Chart 2), it is apparent that the activity is concentrated in just three countries (France and the Netherlands are not surprising and the trades on Estonian credits are actually all sub 1 MM).
With perpetuals, market convention is to show yield to call, however here we have gone for the running yield (purely for simplicity), which gives us an approximate idea of the spread from low to high.
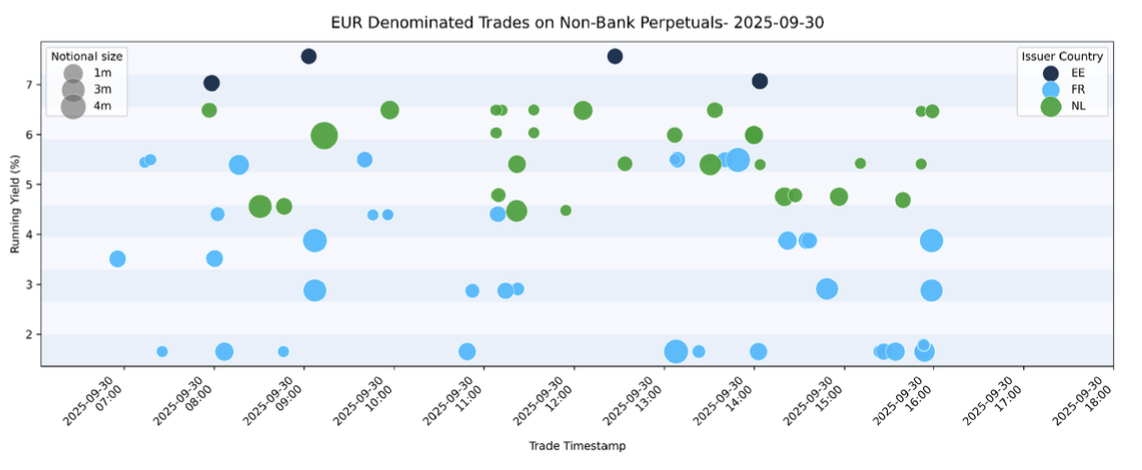
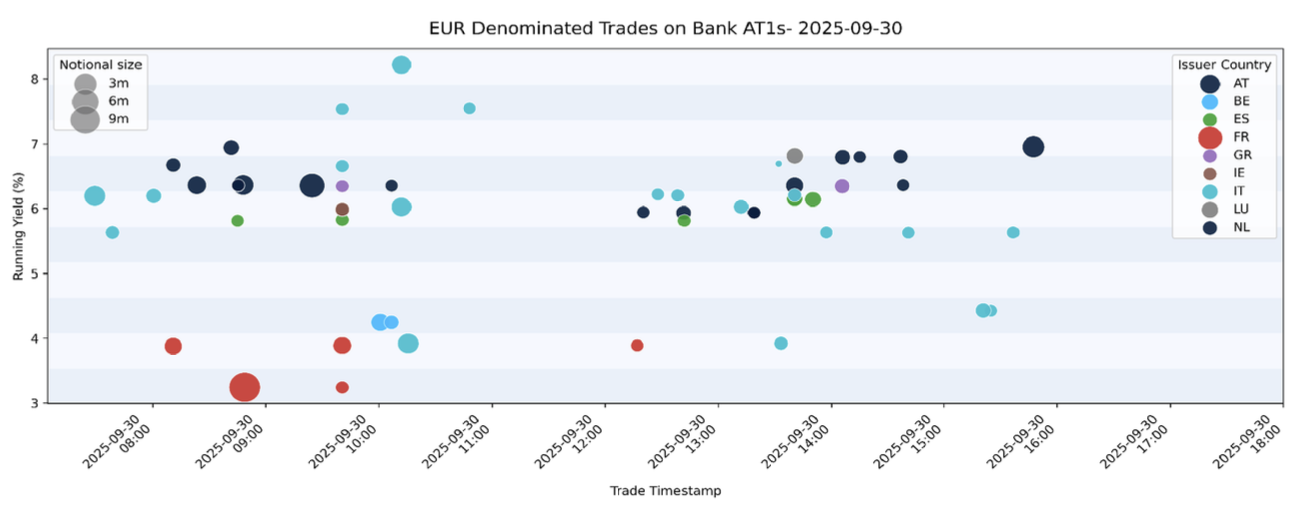
Chart 3 highlights a similar theme for bank AT1s, albeit the range from lowest to highest yield is around 530 bps vs 680 bps for non-banks. It should also be noted that, although bank debt is spread across fewer issuers, the range of countries is far wider.
Overall, it is clear that MiFID data can provide a surprisingly large amount of insight, even in the absence of supporting reference data (for simplicity, we only used regulatory datasets in this analysis).
.png)
.png)
.png)