


In the 1630’s so called ‘Tulipmania’ 1 swept through the Netherlands and led to what is commonly cited as the first major example of an economic bubble2 .
With 2026 around the corner, another major event in the world of Dutch finance is already underway. Whilst it might be slightly hyperbolic to suggest anything on the scale of the Tulip Bubble bursting, it is fair to say that there is significant interest in the upcoming changes to Dutch Pension funds.
What is changing?
Back in 2023, the Future of Pensions Act3 (Wet toekomst pensioenen in Dutch) was passed, changing the way pension funds have to manage their liabilities going forward. It is not dissimilar to a move away from Defined Benefit towards Defined Contribution schemes (to use terminology more familiar to UK-based readers).
Dutch pension funds will have until 1 January 2027 to change their approach4 ;however, some are expected to switch approach on 1 January 20265 , making this a much more pressing matter.
De Nederlandsche Bank (DNB) states5 :
‘Based on market analyst expectations, we estimate that funds will reduce their holdings in government bonds and interest rate swaps with a maturity of 25 years and longer by roughly €100-150 billion. By comparison, €900 billion is outstanding in (semi-)government bonds with such maturities, and the net position of interest rate swaps is over €300 billion.’
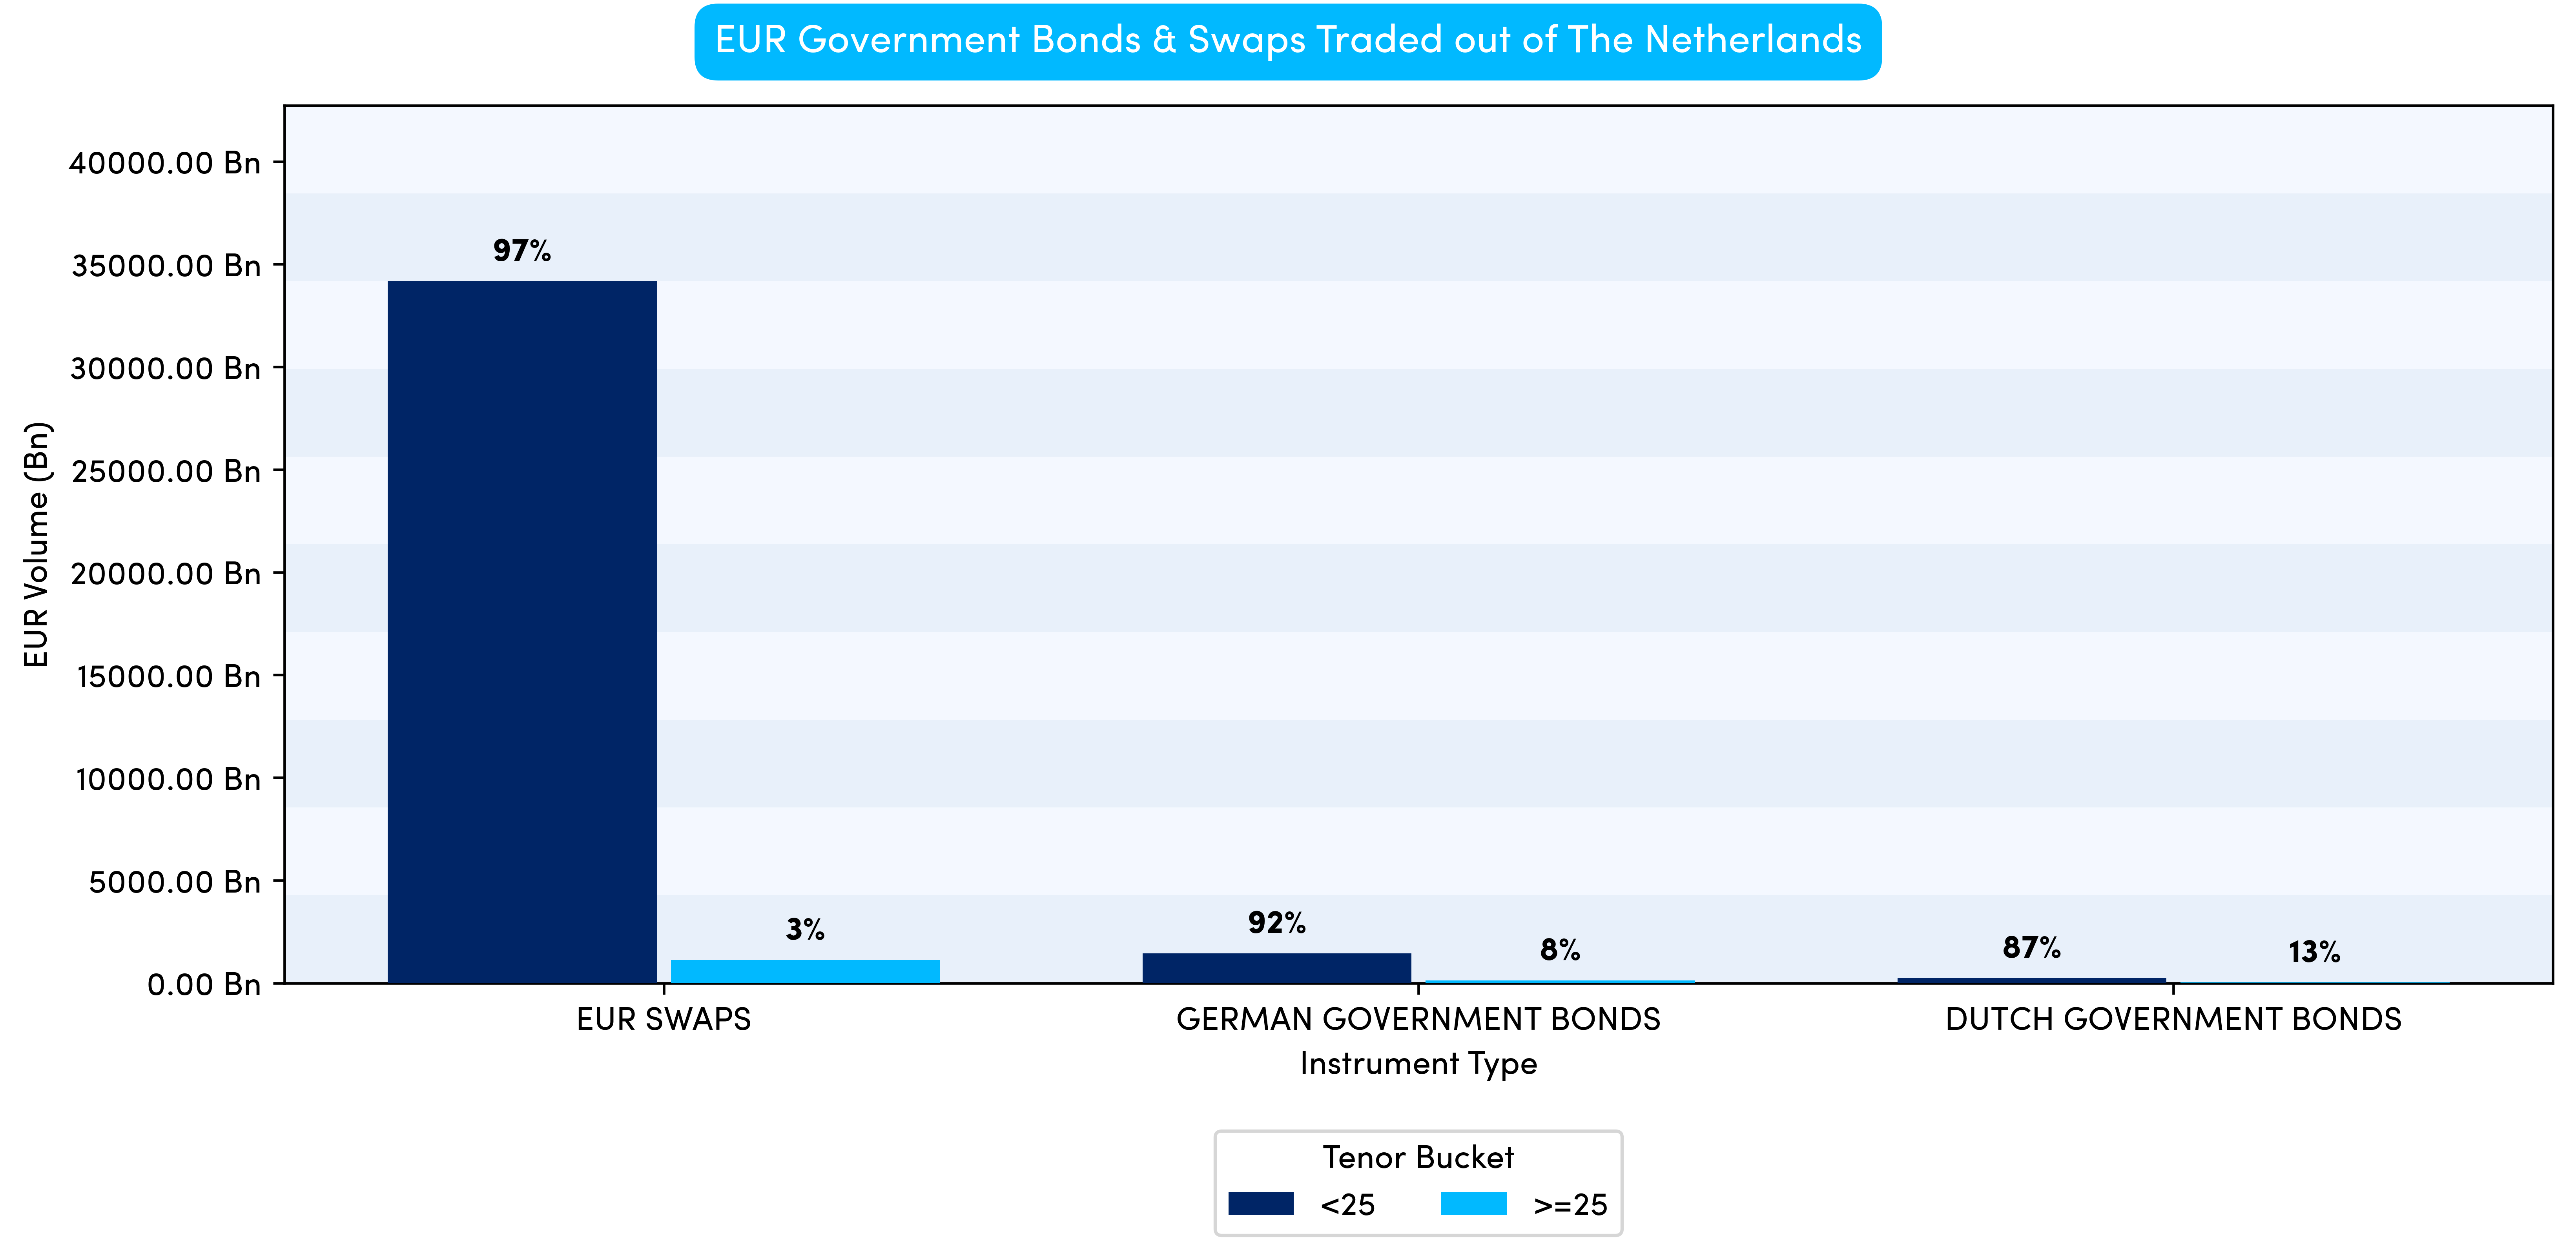
Chart 1 shows the EUR-denominated government bond and swap volumes reported by Dutch MiFID venues, split by longer or shorter than 25 years to maturity.
What does the data show?
It is worth outlining the approach taken in Chart 1. The analysis focuses solely on EUR-denominated securities and furthermore only considers trades reported out of the Netherlands. Whilst its plausible some activity undertaken by Dutch pension funds may be taken in other currencies and jurisdictions, the vast majority should be reported locally in EUR.
The next important observation is the vast difference between bond and swap notionals. Swap volumes unsurprisingly tower over bond volumes. As swaps are OTC derivatives, there is no need to borrow when shorting, a new contract can just be written. Therefore two-way liquidity can often be found with less difficulty than for bonds.
Swap activity is typically concentrated at the front end of the curve and the notional sizes can get into the billions, which for bonds would be very unusual. This is because the risk for short-dated contracts (typically measured as the dollar value change for one basis point, known as DV01) is much smaller than on a long-dated contract (the same is conceptually true for bonds). Chart 2 illustrates flows in DV01 terms throughout 2025.
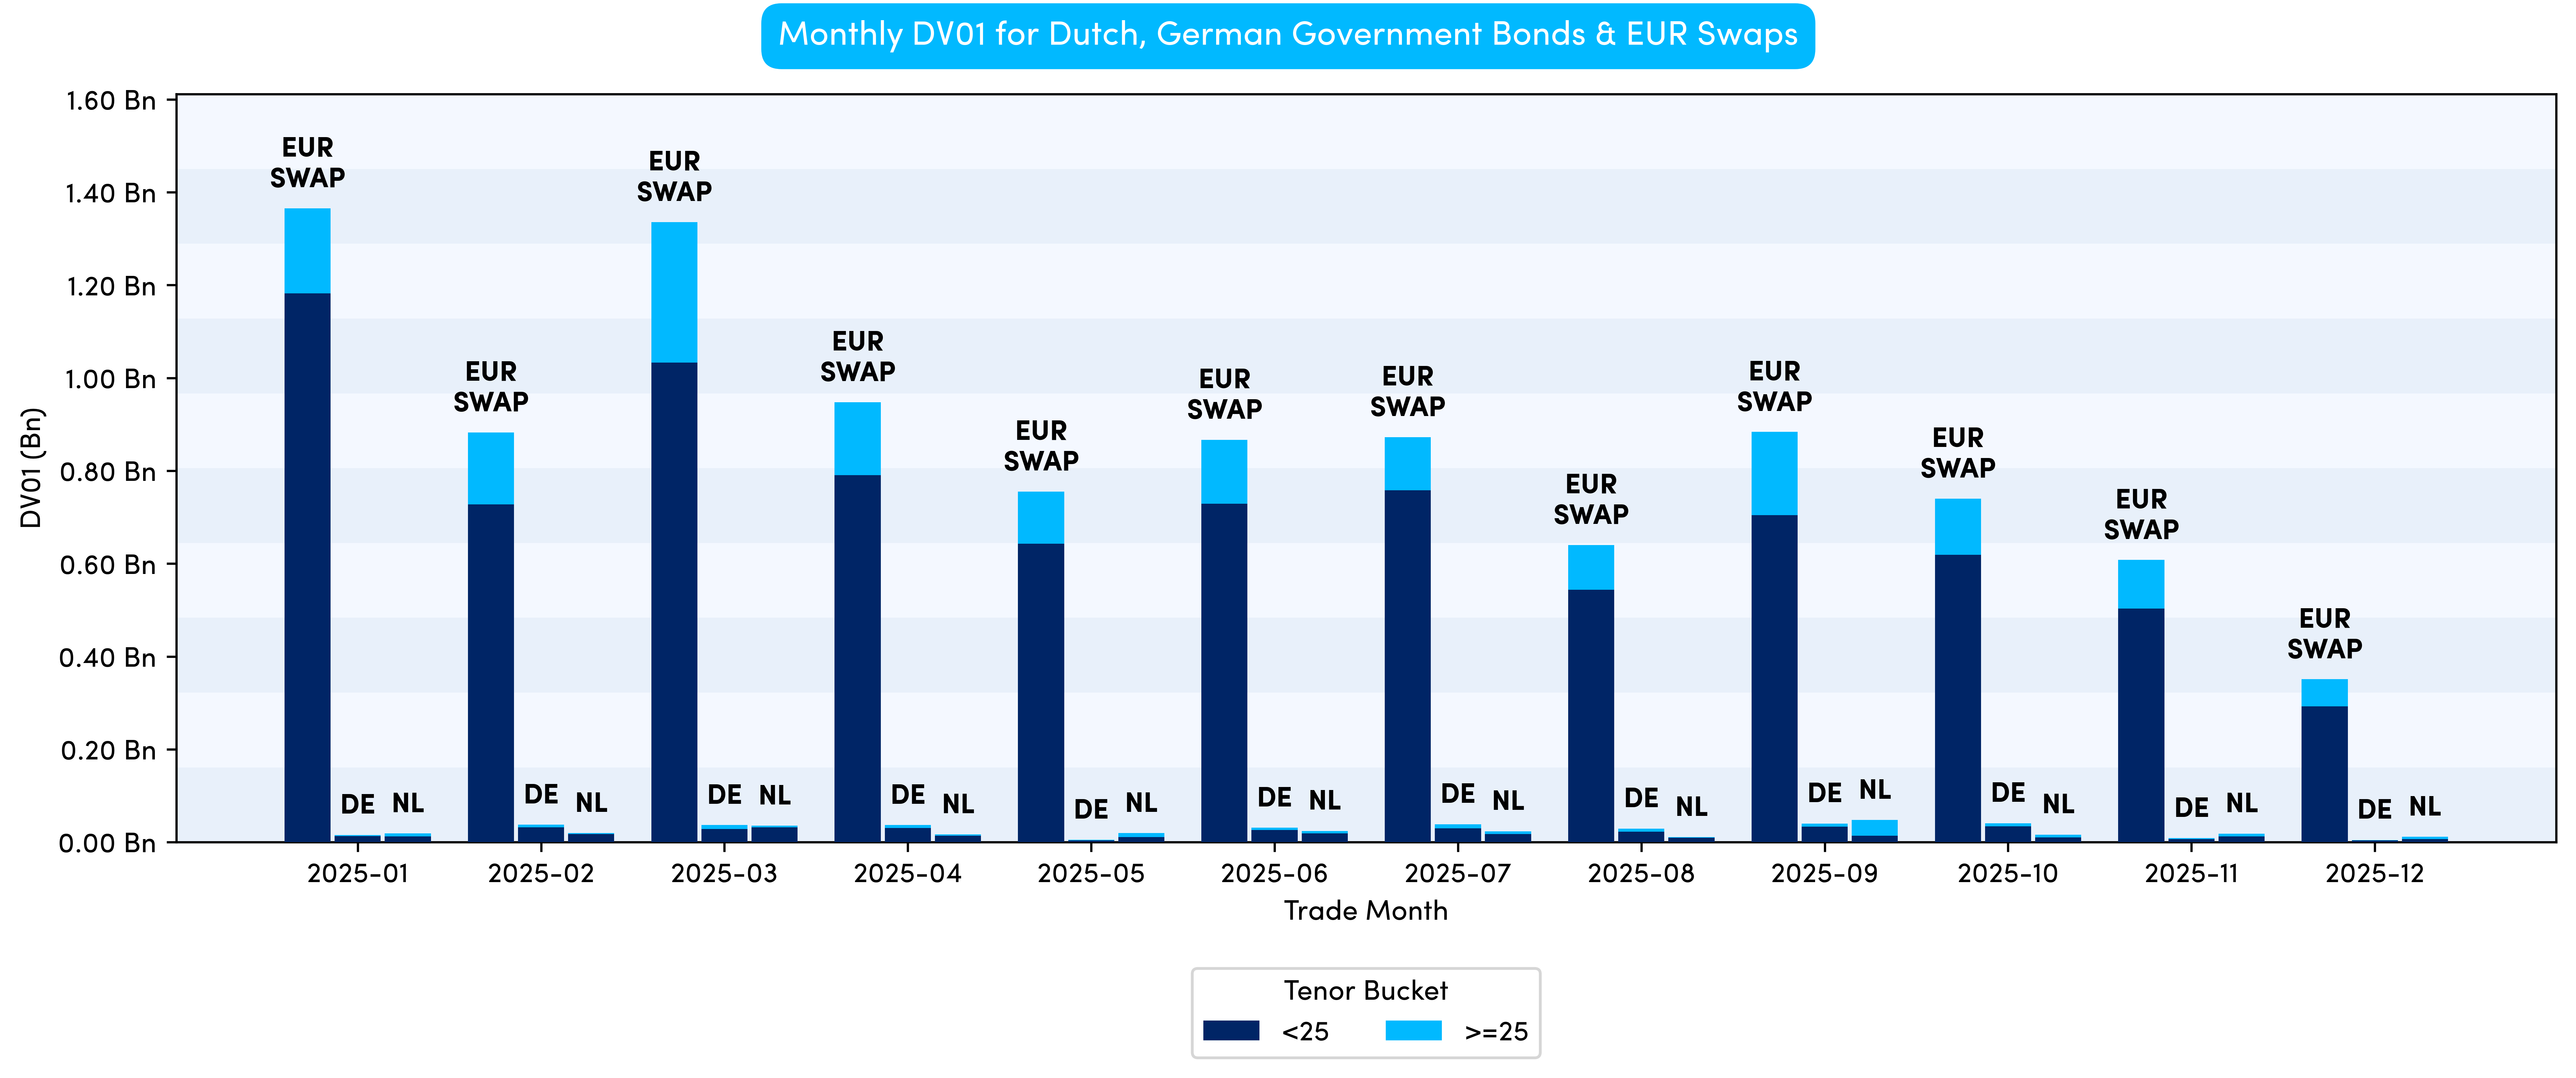
From Chart 2, it is apparent that by considering DV01 rather than notional, the ratio of activity between the over and under 25 years point on the curve skews slightly back towards the longer end. This is as expected and is examined in more detail in Chart 3 on the next page.
It is, however, important to note that there are some caveats here, meaning the numbers shown should only be taken as a proxy. In this example, we are determining a EUR swap by using the CFI code and the currency to give us a broad set of data. If we wanted additional precision, we could drill down by contract type (e.g. by considering only certain reference rates such as 6m EURIBOR). Furthermore, for simplicity, the DV01 calculation for swaps is a proxy (i.e. we do not work through each individual cash flow).
Continuing the theme of completeness, a further consideration is that, due to an equivalence rule, some long-dated EUR swaps may be traded on US SEFs and reported under CFTC part 43 (real-time reporting), rather than via MiFID.
In addition, given the way ESMA deferral rules work, it is likely there is additional volume to be disseminated (particularly for bonds) throughout the remainder of 2025 and even into early 2026.
All that considered, given the disparity between bond and swap DV01, it is reasonable to assume that the numbers should not change too dramatically, even once the deferred data is reported. Chart 3 shows a breakdown in percentage terms, making the splits easier to identify.
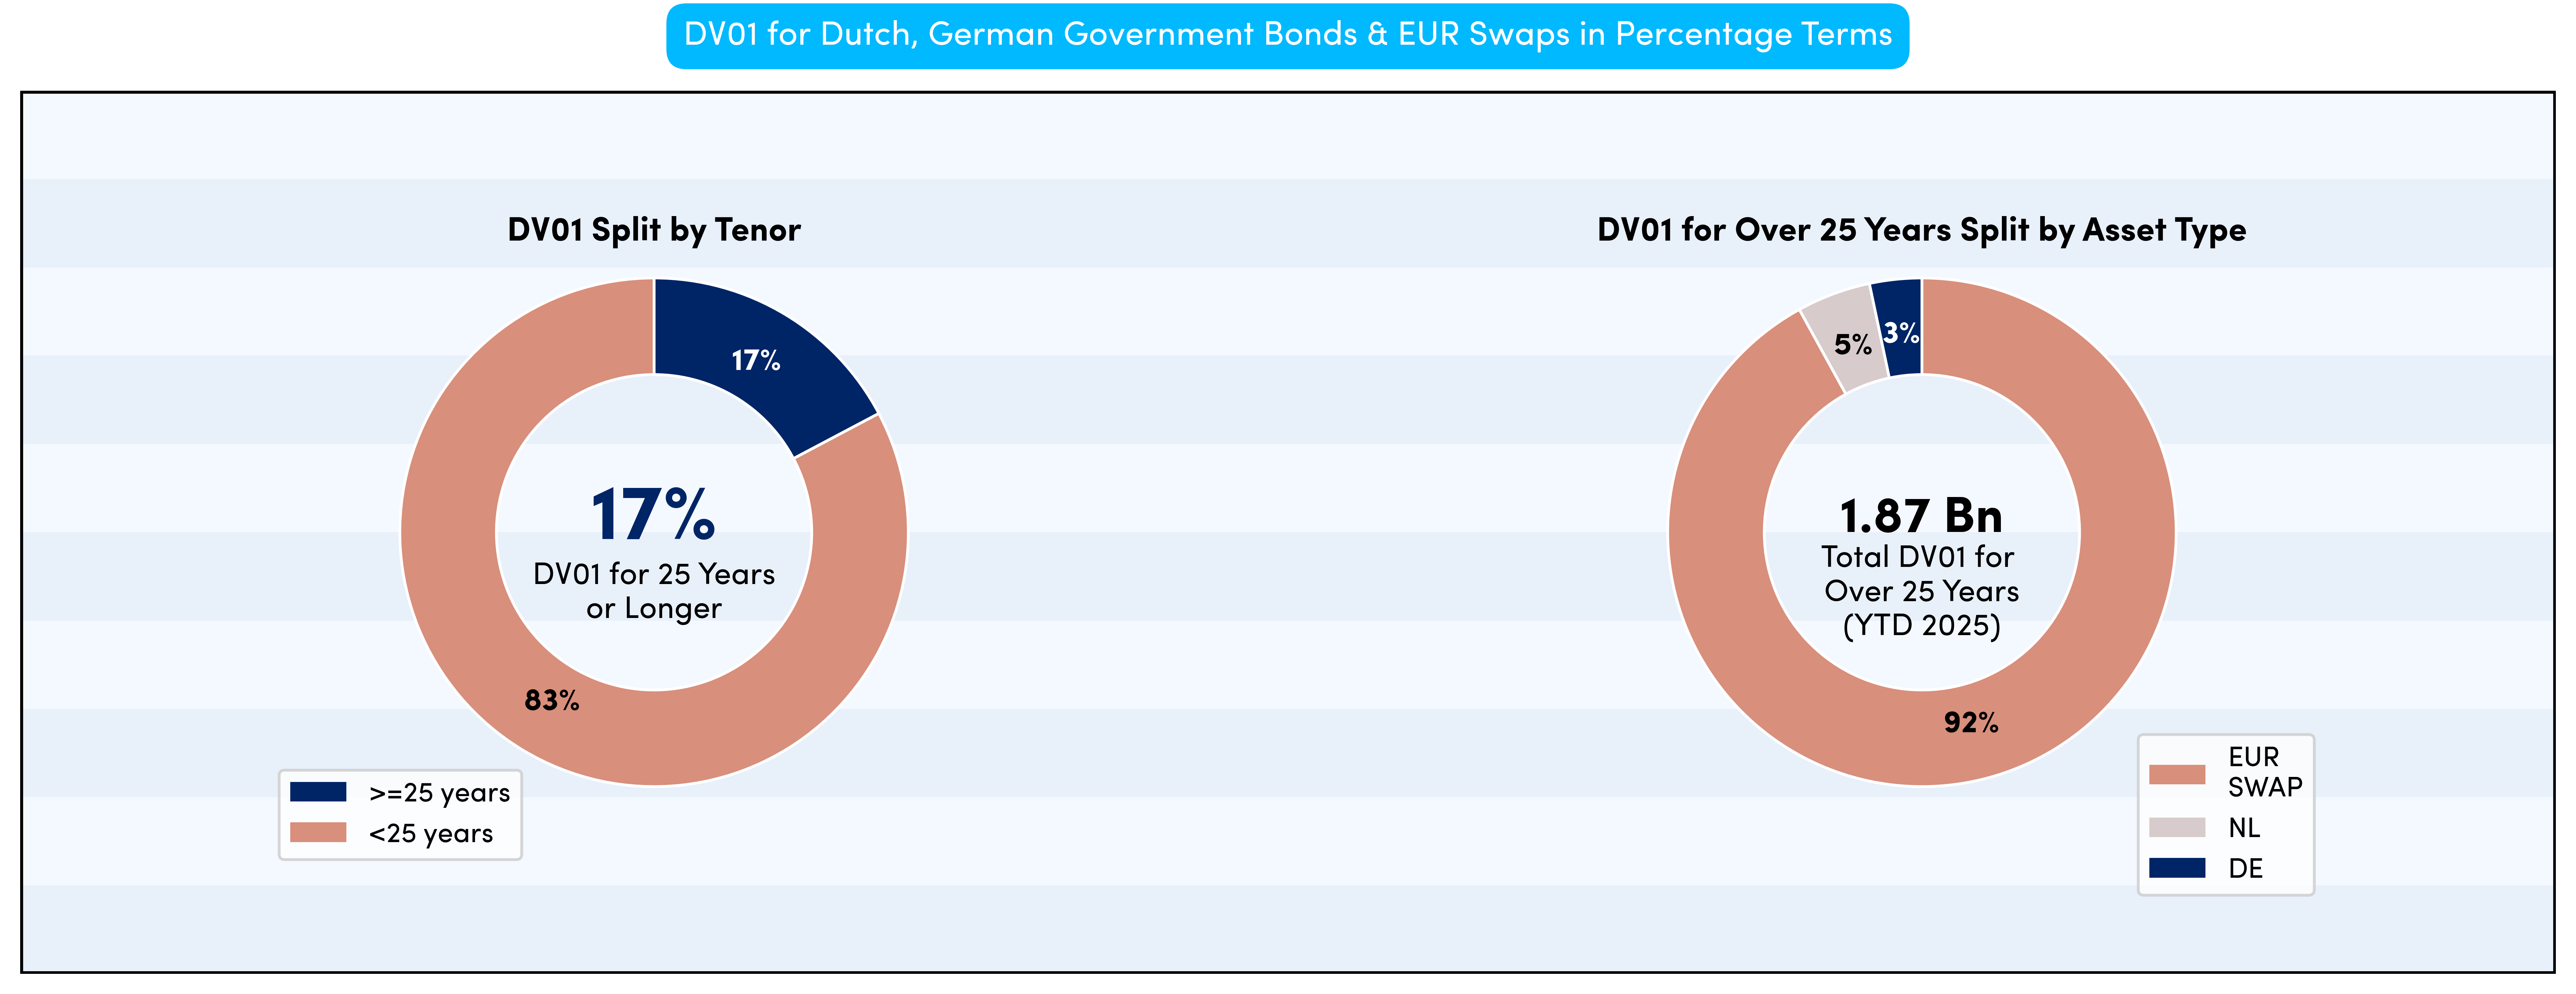
We can see that approximately 17% of DV01 (across bonds and swaps) is related to activity at the long end of the curve (25 years and out), which is a dramatic difference to the notional view shown in Chart 1 (and therefore highlights the importance of considering risk, rather than outright notional volume).
The reported DV01 for the long end (again 25 years and out) was close to EUR 2 Billion, very heavily skewed towards swaps, but perhaps surprisingly Dutch government bonds were 5% compared to only 3% for German Bunds.
German government bonds trade far more frequently, with far higher monthly volumes across all MiFID venues than Dutch government bonds. However, it should be kept in mind that this analysis only focuses and considers Dutch trading venues and APA’s, which partially explains this apparent anomaly.
1https://www.investopedia.com/terms/d/dutch_tulip_bulb_market_bubble.asp
2https://en.wikipedia.org/wiki/Economic_bubble
3https://www.dnb.nl/en/current-economic-issues/pensions/our-new-pension-system/
.png)
.png)
.png)