
Intraday Transparency in US Corporate Bonds: What UK Reporting Data Shows
.png)
Check out our CEO's latest blog, where he takes a closer look at US Corporate bond activity reported in the UK under the new transparency regime.
---
I’ve been spending a bit of time lately looking at the UK’s faster post-trade reporting regime not so much the headline “% real-time” number, but something more practical:
When does transparency actually show up during the day?
And does it look different if you measure trade count versus notional?
The charts referenced below show US Corporate bond activity reported in the UK under the new regime, using average daily intraday patterns for January 2026. This is grouped hourly whilst showing both absolute volume and percentage.

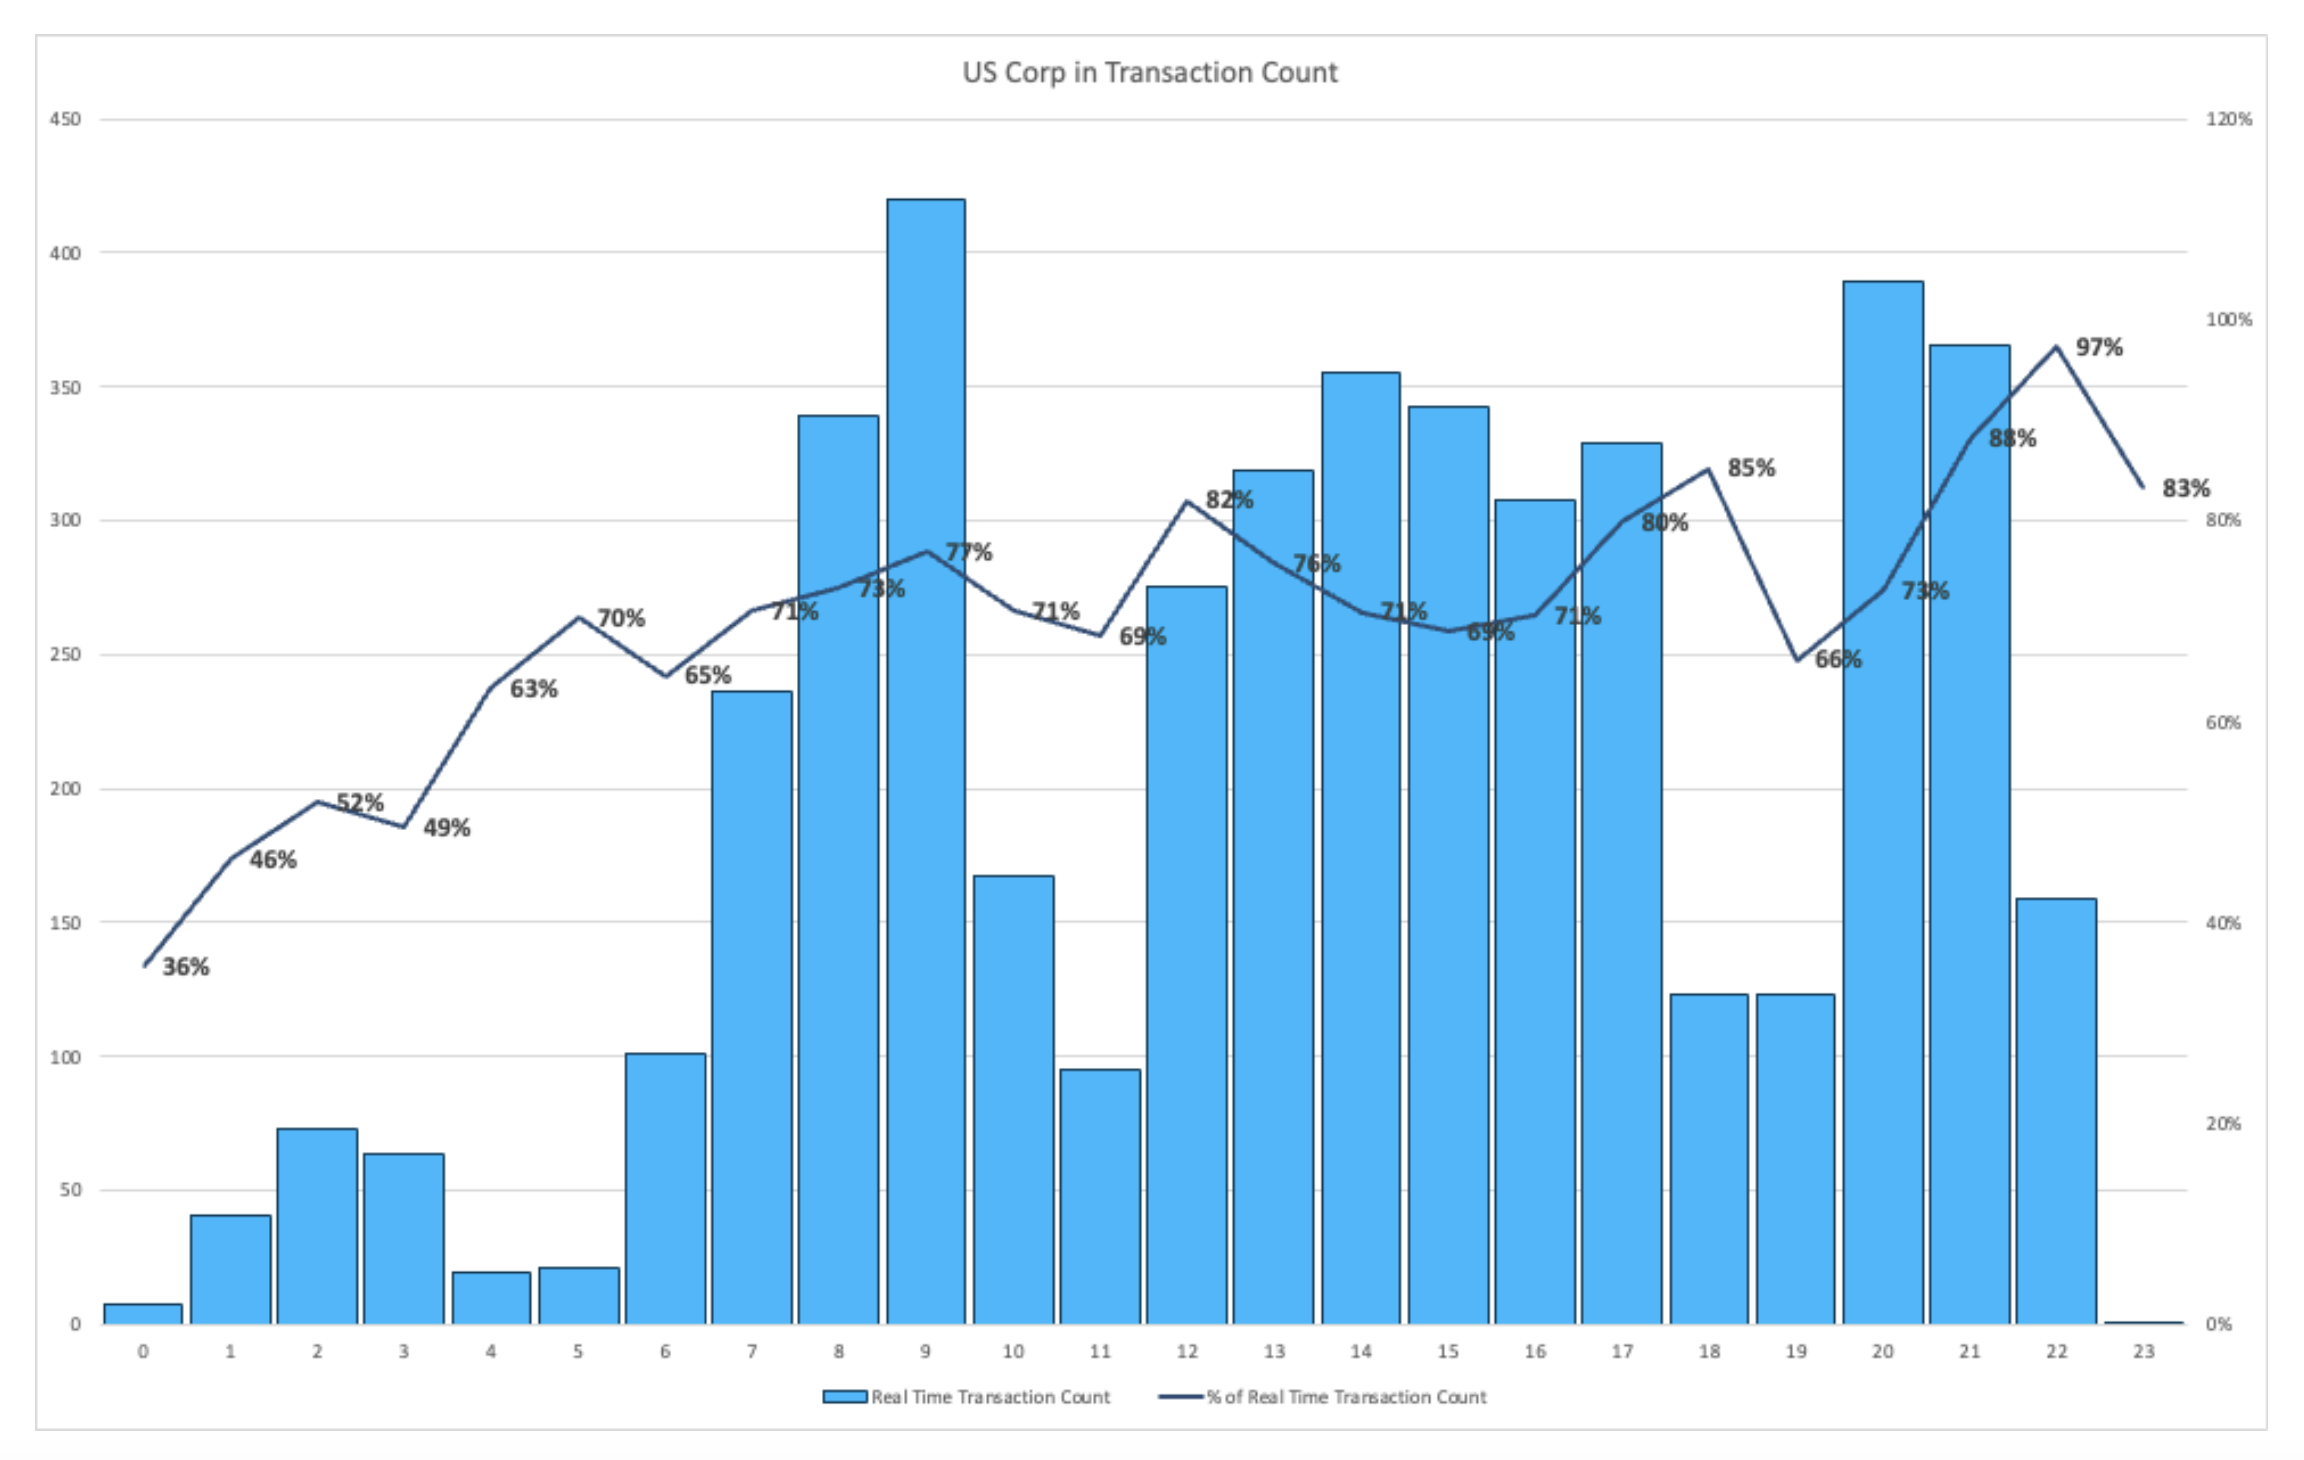
To complement the hourly averages above, the chart below shows the same story in a more “continuous” way: total notional by time of day, split between Real-time and Deferred reporting. This clearly highlights that activity comes in three clear waves spread throughout the day.

What jumped out to me
1) Activity is clustered in time: It arrives in waves
The first observation is simple but important: US Corporate activity (reported under the new UK Transparency regime) is not evenly distributed throughout the day, instead, there are clear spikes where activity is concentrated, rather than an even distribution.
This is an interesting observation as it highlights there are periods where the market is typically more active (and higher flow is clearly observable) and times when activity is limited.. Understanding this dynamic is important when building pricing models, liquidity scores, or analytics work as assuming a stable “average” market could result in poorly calibrated models.
2) The transparency picture differs for trade count vs notional
The second observation is the key transparency signal: The real-time share is consistently higher for trade count than for notional volume.
Put simply, the transaction based liquidity (as opposed to volume based) is observable in a much shorter timeframe, this is important as differing conclusions could be reached when considering a transaction count rather than volume based approach.
3) Deferrals have a purpose
The gap between real-time trade count and real-time notional isn’t surprising, the new UK transparency regime aims to keep a balance between transparency and liquidity provision (i.e. showing small trades in real-time is deemed to be beneficial, however larger risk transfers have more scope for deferral to allow market makers an opportunity to exit their position).
What’s useful here is how clearly this design feature shows up hour by hour. The tape looks “busy” and highly transparent, given the number of prints, however in reality (when considering the overall notional volume) it is materially less complete.
So “transparency” depends on the lens:
- Count-based transparency tells you how quickly the market becomes visible for breadth (signals, price formation, frequency of prints).
- Notional-based transparency is more about depth (how much size is actually observable in real time).
So what?
For me the takeaway is: transparency isn’t just “more” or “less.” It has a timing profile, and it behaves differently depending on whether you look at count or notional, especially when deferrals are part of the design.
Curious how others see this: do you expect faster reporting to improve execution quality broadly or will it mostly affects maller ticket sizes with limited impact on larger transactions?
Important coverage note: what’s included today (and what isn’t yet)
One detail is crucial for interpreting the notional picture correctly. This dataset currently captures only trades reported as Real-time, T+1D, and T+2W. Trades in the longest deferral bucket (3 months) won’t start being observable until March 2026. We don’t expect the addition of T+3M to materially change the transaction count picture but it could meaningfully increase the amount of non-realtime volume reported.

.png)
.png)
.png)