

.png)
This year is full of exciting developments within the fixed income transparency space. We have already seen the new FCA transparency regime launch with considerable impact, and this week it was ESMA’s turn. Before we dive in, it is important to recap the other upcoming changes over the next few months.
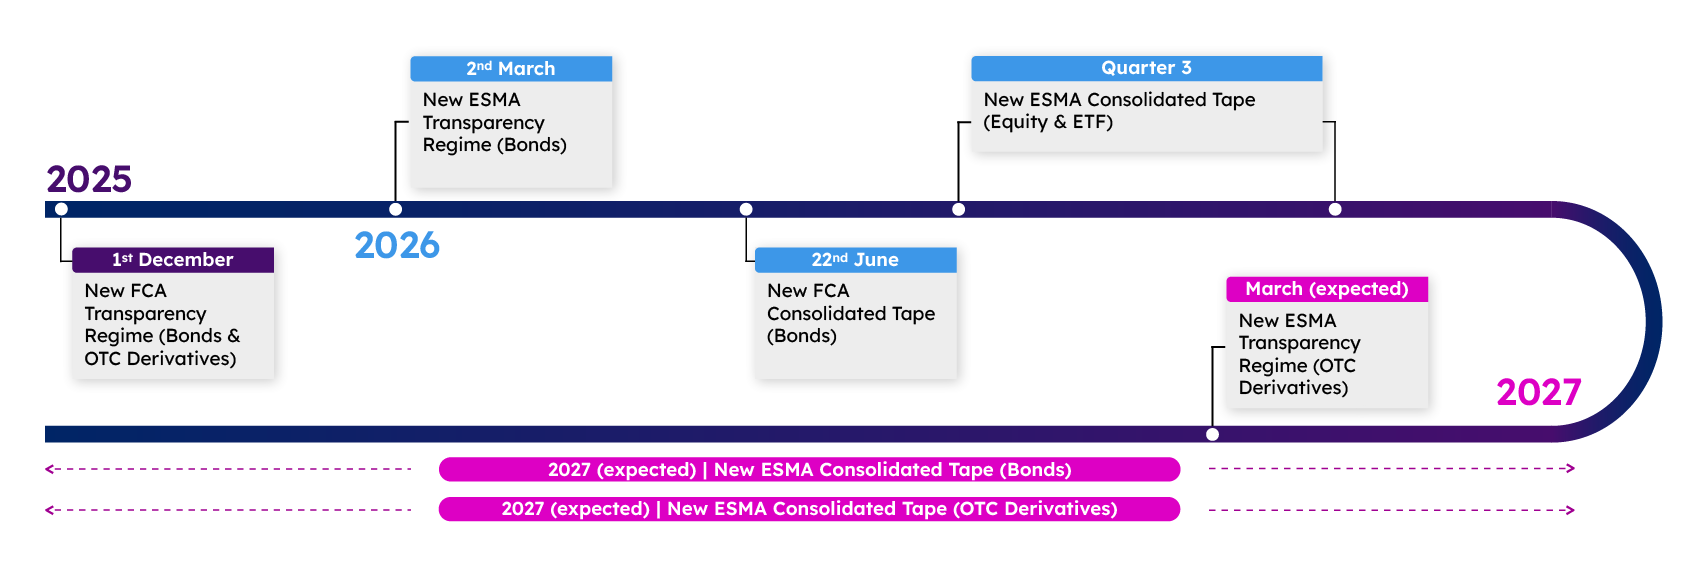
So far, both ESMA and the FCA have successfully launched their respective transparency regimes; however, there are some differences in scope. The FCA regime covers bonds, Interest Rate Swaps (IRS) and Credit Default Swaps (CDS) as well as some exchange-traded derivatives. ESMA, on the other hand, will implement their OTC derivatives changes in March 2027. Until then, IRS and CDS will continue to follow the existing reporting rules, whereas bonds changed as of Monday.
One additional point to note is that ESMA clarified that there would be no more aggregation for sovereign bond transactions. The only adjustment with regards to deferrals would apply to the ‘Medium-Liquid’ bucket within Group 1 . In short, this means that if a sovereign bond trade meets the following criteria:
Then its price will be published within 15 minutes; however, the size will not be shown until EOD. For Slovakia, the above does not apply and the size will be published after 15 minutes along with the price.
Whilst the past few months have been significant, there are plenty further initiatives lined up over the coming months (and years).
Firstly in June, the UK bonds Consolidated Tape (CTP) is expected to launch. This will make it possible, for the first time, to get MiFID (bond) data reported to the FCA in real-time. If you would like to find out more about this development, please speak with your Propellant Sales representative.
The next development is the ESMA equities tape. Whilst this may appear out of scope from a fixed income perspective, ETF activity will be delivered within a tape. Hence, it may be of interest to not just to ETF traders, but also to teams who need to monitor the performance of the basket vs the underlying instruments.
Looking further ahead, towards late 2026 or early 2027, the ESMA bond CTP is likely to be the next key deliverable from a transparency perspective (although the exact date has not yet been released).
The ESMA OTC derivative transparency changes are due to take effect in March 2027, and it is likely that the ESMA OTC derivatives CTP may go live shortly after.

As outlined, a lot of initiatives are planned. For now, however, we will focus on the one that has just gone live: ESMA’s new transparency regime (for bonds).
We start off with a look at publication times throughout the day, and in Chart 2 over the page we contrast the number of reports per hour reported under the ESMA regime compared to the FCA regime (as the objective is to see the raw number to determine when systems may be under the most stress, we do not strip out cancel/amends here).
The data shows two clear points of stress, with the majority of reports published between 06:00-07:00 and 17:00-18:00.
Back in Propellant Insights issue 21, we took an initial look at publication times under the FCA regime (as ESMA’s had not yet gone live). At that time, the bulk of activity was at EOD, when the T+1 reports came in. Combining two regimes, EOD is still a stress point for the ESMA regime. However, there is also a significant number of reports published before 07:00 UTC.
Looking at the new ESMA deferral rules, this spike might seem strange. However, it can be explained in two parts.
- Firstly, although indefinite aggregation for sovereign bonds (and four-week deferral for corporate bonds) have been discontinued, historic trades will still be reported during the early days of this regime. As these aggregated reports are phased out, early morning reporting may decrease.
- Secondly, ESMA covers a wider geographic region than the FCA regime, spanning multiple time zones, with some markets starting 2 hours before trading typically opens in London.
Whilst Chart 2 is most relevant when considering infrastructure (i.e. highlighting at what points in time internal systems could be under the most stress), Charts 3 and 4 take a different view, focusing on factors that are more meaningful for trading desks.
In chart 3, the MiFID reporting data is split by currency, starting with G10 currencies.
Unsurprisingly, the overall distribution is similar to that shown in Chart 2. One key takeaway, however, is that a lot of early morning activity is actually in USD, not just in EUR. GBP activity tends to be fairly constant throughout the day, and aside from Japanese Yen and Swedish Krona, most other activity is concentrated in pockets (i.e. AUD trades are typically reported early in the European day).
There are not a great deal of surprises here, but one of the interesting aspects of MiFID reporting is the wide range of currencies.
OTC derivative reporting in the UK is now limited to EUR, GBP, and USD (with ESMA set to follow in March next year, albeit they also include JPY for IRS). For bonds, the range is effectively unlimited, with (almost) any activity in scope so long as it occurs on a UK or European venue and/or with a UK or European counterpart.
Chart 4 below provides a further breakdown of reporting activity by continent (i.e. the continent associated with each currency). By removing EUR and USD activity in particular, the shape of the distribution has changed noticeably, with the spike at the start of the day disappearing and the spike at the end of the day dominating.
Chart 4 only takes into account trades reported via MiFID on non-G10 currencies. As there are far too many for a chart to be meaningful, a split by continent provides a much clearer picture of the trends.
As expected, the bulk of activity throughout the day is on European currencies (including the likes of PLN, RON, SEK etc.). However, Mexican pesos, various Asian currencies, and even African currencies, make up a substantial portion of the reported trades.
Of particular note is the end-of-day spike, which is split across five continents. Interestingly, the majority of activity is assigned to Africa. Whilst this may come as a surprise, it becomes more logical when considering that ZAR (South African Rand) bonds are included here and account for the bulk of this spike.
For anyone wishing to look deeper into the breakdown of African bonds reported via MiFID, please refer to Propellant Insights Issue 19, where we examined this topic in more detail.
So far in this issue, we have looked at the distribution of reports throughout the day across both ESMA and FCA venues, whilst also looking ahead to the upcoming changes.
We conclude by looking back at week 1 of the new ESMA regime. Chart 5 below shows the change in transaction counts between the old and new regimes (this view only includes EUR, GBP and USD activity).
There are no trades deferred for four weeks yet, but in percentage terms, the increase across every category is substantial, particularly for GBP corporate and agency bonds. This is not overly surprising, as GBP issues were often deemed illiquid and scarcely reported (in real-time) under the old rules.
EUR and USD corporates also show significant increases. For corporate bonds in particular, the new regime looks to be dramatically increasing transparency; however, it is important to note some differences between ESMA and the FCA’s respective approaches.
Under the ESMA regime, there is no specific High Yield category; however, a trade for EUR 5 million could be reported in 15 minutes if the issue size was EUR 500 million or larger. Under the FCA rules, the same trade would be reported on T+1 if the issue size was at least GBP 500 million, or after 2 weeks if it was smaller.
Over the next few weeks, Propellant will continue to explore the diverging regimes and highlight some of the more interesting themes, including a look into the first batch of FCA-reported trades deferred for three months.
.png)
.png)
.png)