

.png)
All readers are likely familiar by now with the results of the Hungarian election , with the Péter Magyar (leader of the Tisza Party led and former Fidesz member) comfortably winning the election1, defeating the Prime Minister Viktor Orbán. Inevitably, this has led to some interesting price action in Hungarian Government Bonds.
As we have seen in recent weeks, Government bond transactions are typically now reported in a fairly short timeframe. Specifically, considering European Government Bonds (EGBs), our analysis shown in Propellant Insights Issue 29 suggests that over 90% of transactions are currently reported in 15 minutes or less.
Hungarian Government Bonds (HGBs), however, are denominated in HUF (they do also issue in EUR) and the reporting profile differs quite dramatically to that of more liquid EGB issuers.

Chart 1 shows the breakdown for both ESMA and the FCA, comparing the reporting times from March/April 2025 to March/April 2026.
Previously, under both regimes, the vast majority of trades were indefinitely deferred (meaning a transaction-level breakdown was never shown). However, nearly 60% of ESMA transactions are now reported in under 15 minutes and around 10% reported via the FCA.
Whilst deferrals on HGBs might be slightly longer (on average) than EGBs, this is not necessarily due to the election and may reflect the differing nature of the two markets. In order to gain more insight, we can use the MiFID data to look at the yield curve changes, as shown in Chart 2 below.
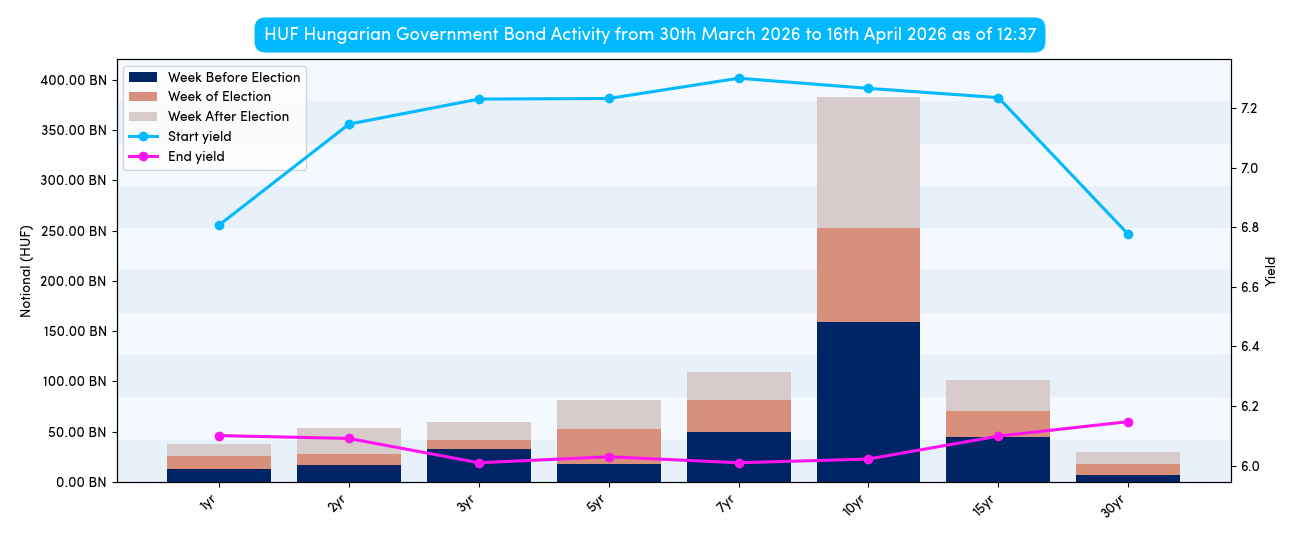
Yield curve shifts around elections have been examined previously in Propellant Insights Issue 4 and Issue 18, so regular readers will know that curves can move dramatically around election periods, and this instance is no exception.
The Hungarian curve shows most activity was (unsurprisingly) concentrated around the 10-year point (typically the most liquid and/or most cited in media coverage). However, the main story is not the volume, but the curve movement itself, which tightened (moved lower) by 100 or more basis points almost universally across the curve.
Interestingly, the curve was humped prior to the election (with both the long and short ends having a tighter yield than the belly of the curve), completely inverting afterwards.
Given the political change currently inflight, this curve change is perhaps not totally unexpected. However, further insight can be drawn by considering the bid/offer spread on the next part of the article.
A common assumption about MiFID data is that it focuses solely on post-trade data (i.e. reports of trades that have already occurred). However, pre-trade (quote) data is also included for certain venues2, specifically those operating an order book or periodic auctions3.

Chart 3 illustrates the average bid/ask spread (along with the range), per bond, across the Hungarian curve. The bid/ask tends to widen as the maturity date of each bond increases, which is logical, because the change in price associated with a single basis point move in yield typically increases as the time to maturity climbs. This measurement is known as the Dollar Value of 1 basis point (DV01).
Chart 3 also shows that the spread range deviates (sometimes quite dramatically) from the mean, which could suggest volatility on multiple bonds.
This insight is valuable, as the yield curve changes alone do not clearly indicate whether bonds were liquid or volatile; they simply show the yields moved down (i.e. the prices increased). By additionally considering the bid/ask spread, it is possible to infer that price volatility was likely (which is not unexpected during an election period).
To further assess this, we can take a look at a single bond and see if the suggested volatility really occurred.
The 4.75% 32’s was selected for further analysis. This bond is in the middle of the curve and has some bid/ask spread volatility, so it should make an interesting candidate (see Chart 4).

We can see the price trends upwards throughout the period. This is not new information, as price is inversely proportional to yield; given yields tightening observed in Chart 2, this outcome is expected. Volume spikes are also visible on specific days throughout the period, indicating that trades were not reported every day on this bond, which is not uncommon for less liquid issuers such as Hungary. An inferred buy or sell direction can be also observed for each trade.
Unlike FINRA’s TRACE offering, MiFID data does not show the side/direction of the trade (i.e. whether it is a buy or sell), so instead we can only make an assumption. This can be done by overlaying pre-trade (quote) data and assessing whether the trade at a given timestamp was closer to the bid side (implying a dealer buy) or the offer side (implying a dealer sell).
A further observation from this chart is the price volatility. Whilst not exceptional, the gap between the bid and ask lines can be seen to both narrow and widen over time. In addition, various spikes or troughs occurring when a trade prints (indicated by the bright or dark blue bubbles) suggest that there was at least some price volatility over the period.
This analysis highlights the versatility of MiFID data. In addition to volumes, it enables visibility into yield and price movements, bid/offer spread trends, and even the estimation of direction.

.png)
.png)