

Conventional wisdom tells us that activity typically picks up on the last working day of the month. This week we examine if this statement holds up and whether factors such as time since issuance and the type of bond impact this.


It has generally been accepted that month end is a busy period within financial markets, and in the fixed income space this is often attributed to month-end rebalancing1. This is typically conducted by portfolio managers looking to ensure their portfolio closely reflects the index or benchmark they are tracking (allowing for deviation where a mandate permits).
This week we start by assessing the claim that month end flows are higher with a simple analysis of secondary flow, split by bond type.
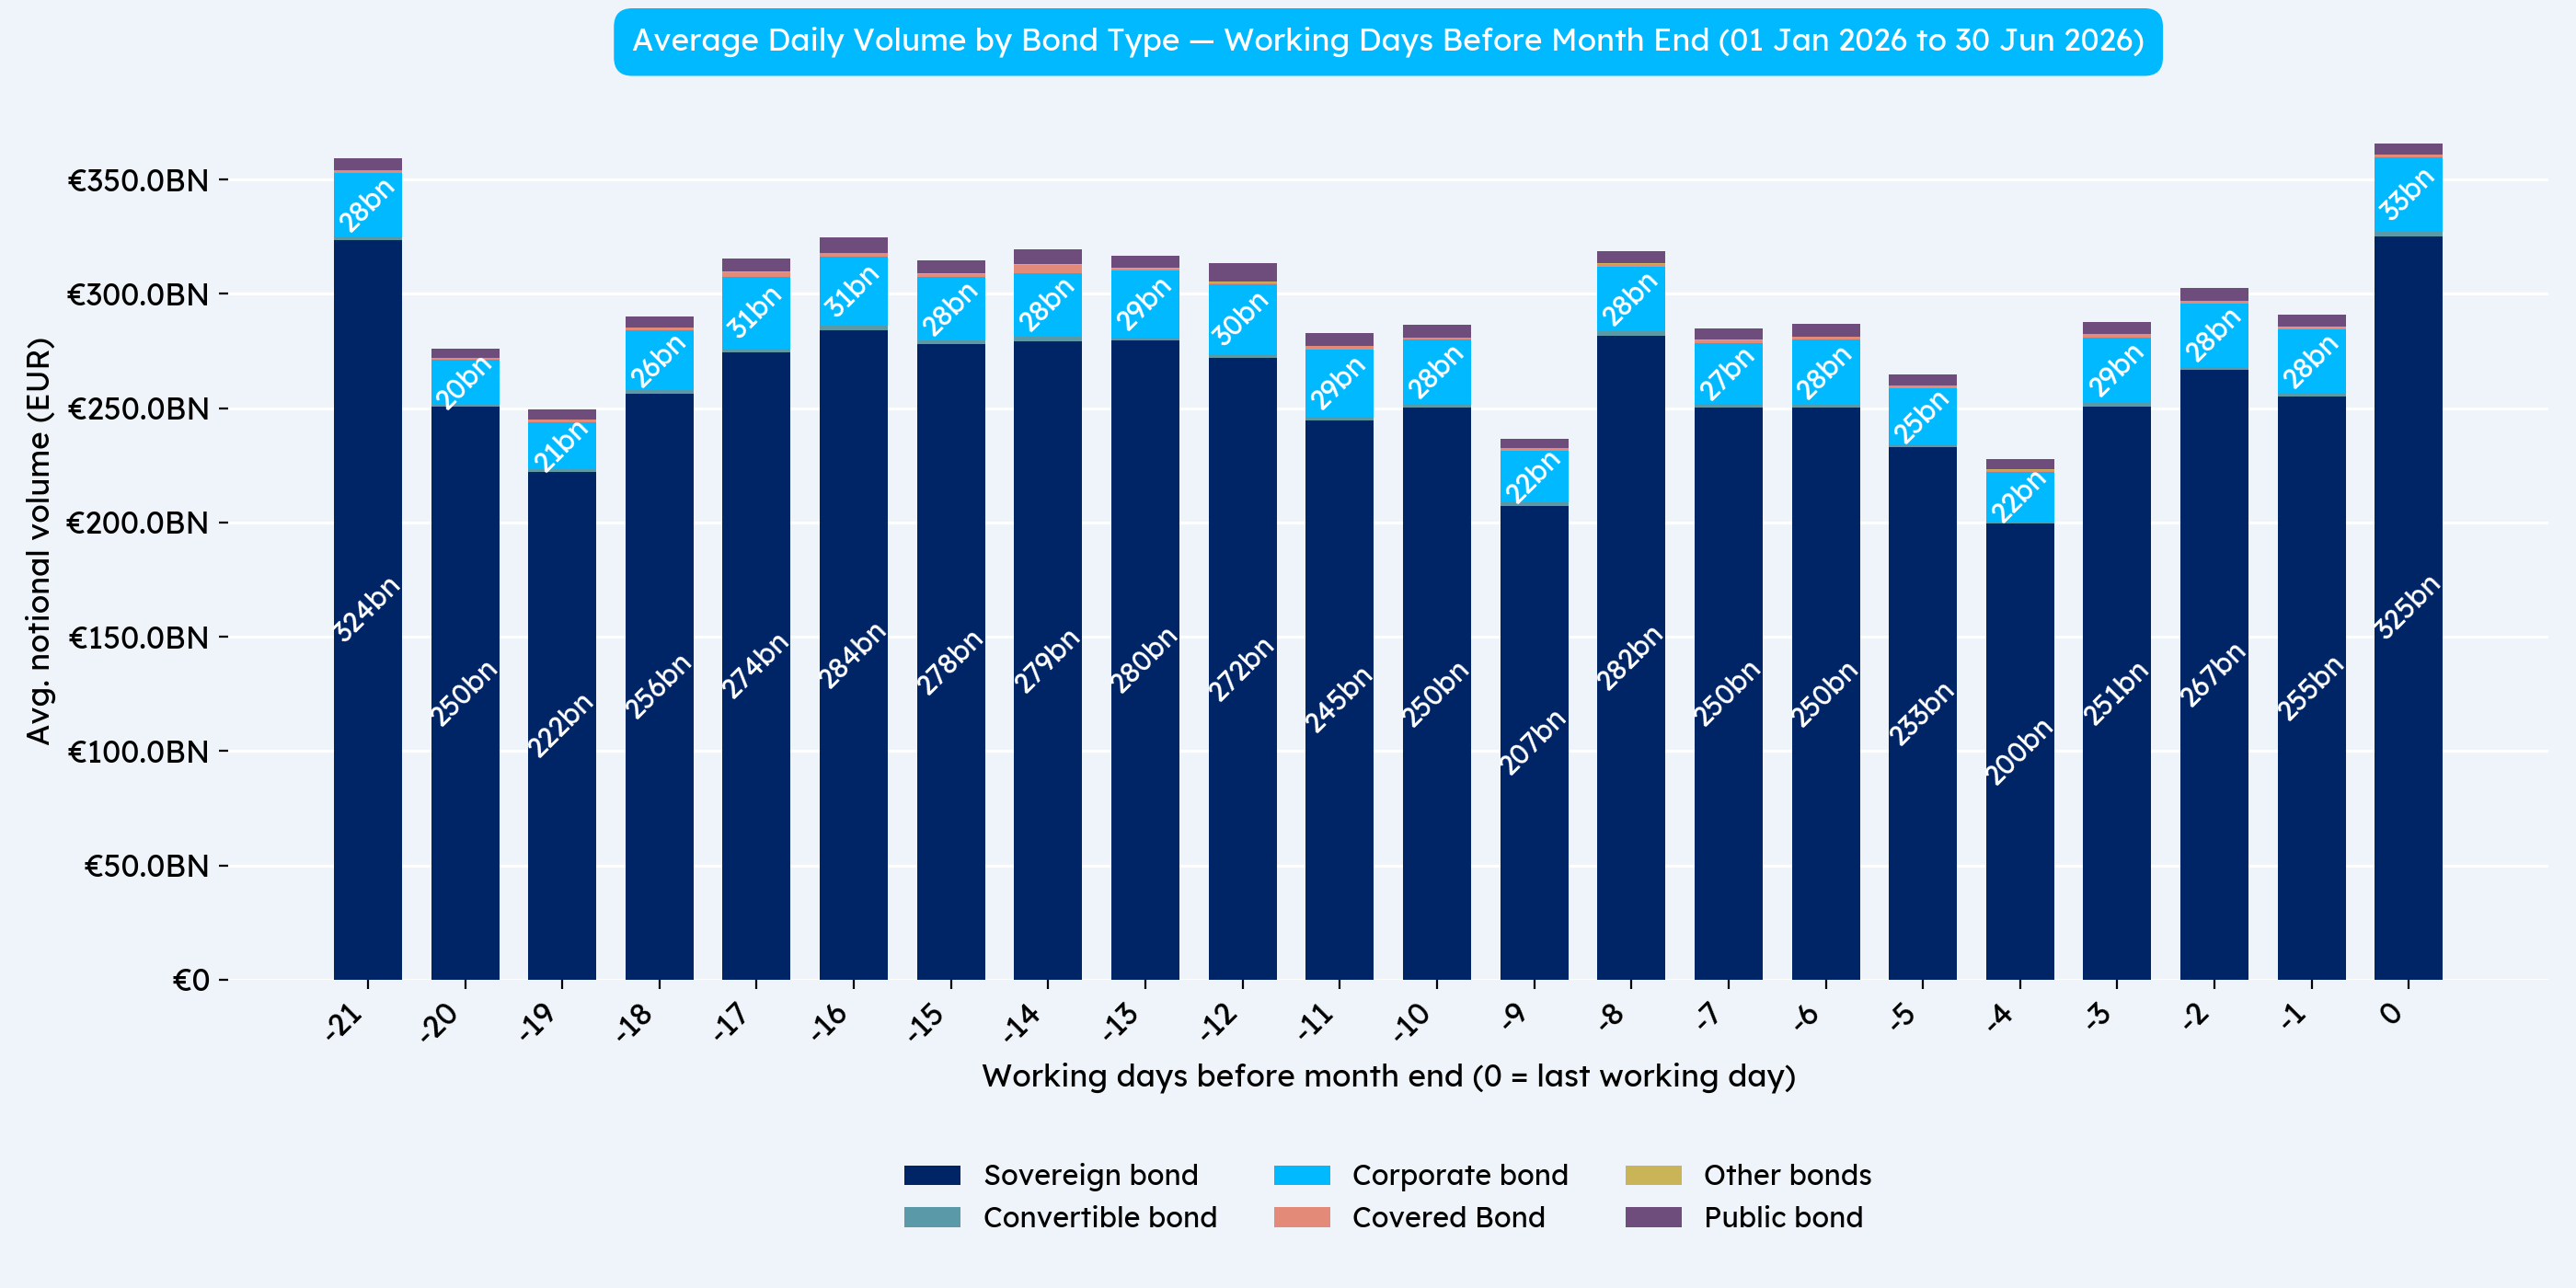
Chart 1 above shows that flows are typically larger than average on the last day of the month across all types of bonds (but perhaps not by the margin expected). However potentially more interesting is the observation that the first day of the month is equally as active.
This could be due to month end activity occurring throughout in the final week, which may run into the next month. Alternatively it could be because liquidity does not always allow for orders to be filled in a timely fashion and some activity typically does not complete until the first few trading days of the next month, and/or that dealers contiue trading out of client positions into the new month.
To understand why the data does not wholly fit our assumption that activity is heavily skewed towards month end, we next examine days since the first admission to trading. We can use this as a proxy for issuance date as it is contained within the FCA Financial Instrument Reference Data System.
We look at the volumes by working day of the month again, only this time we have removed any new issues in the given month.
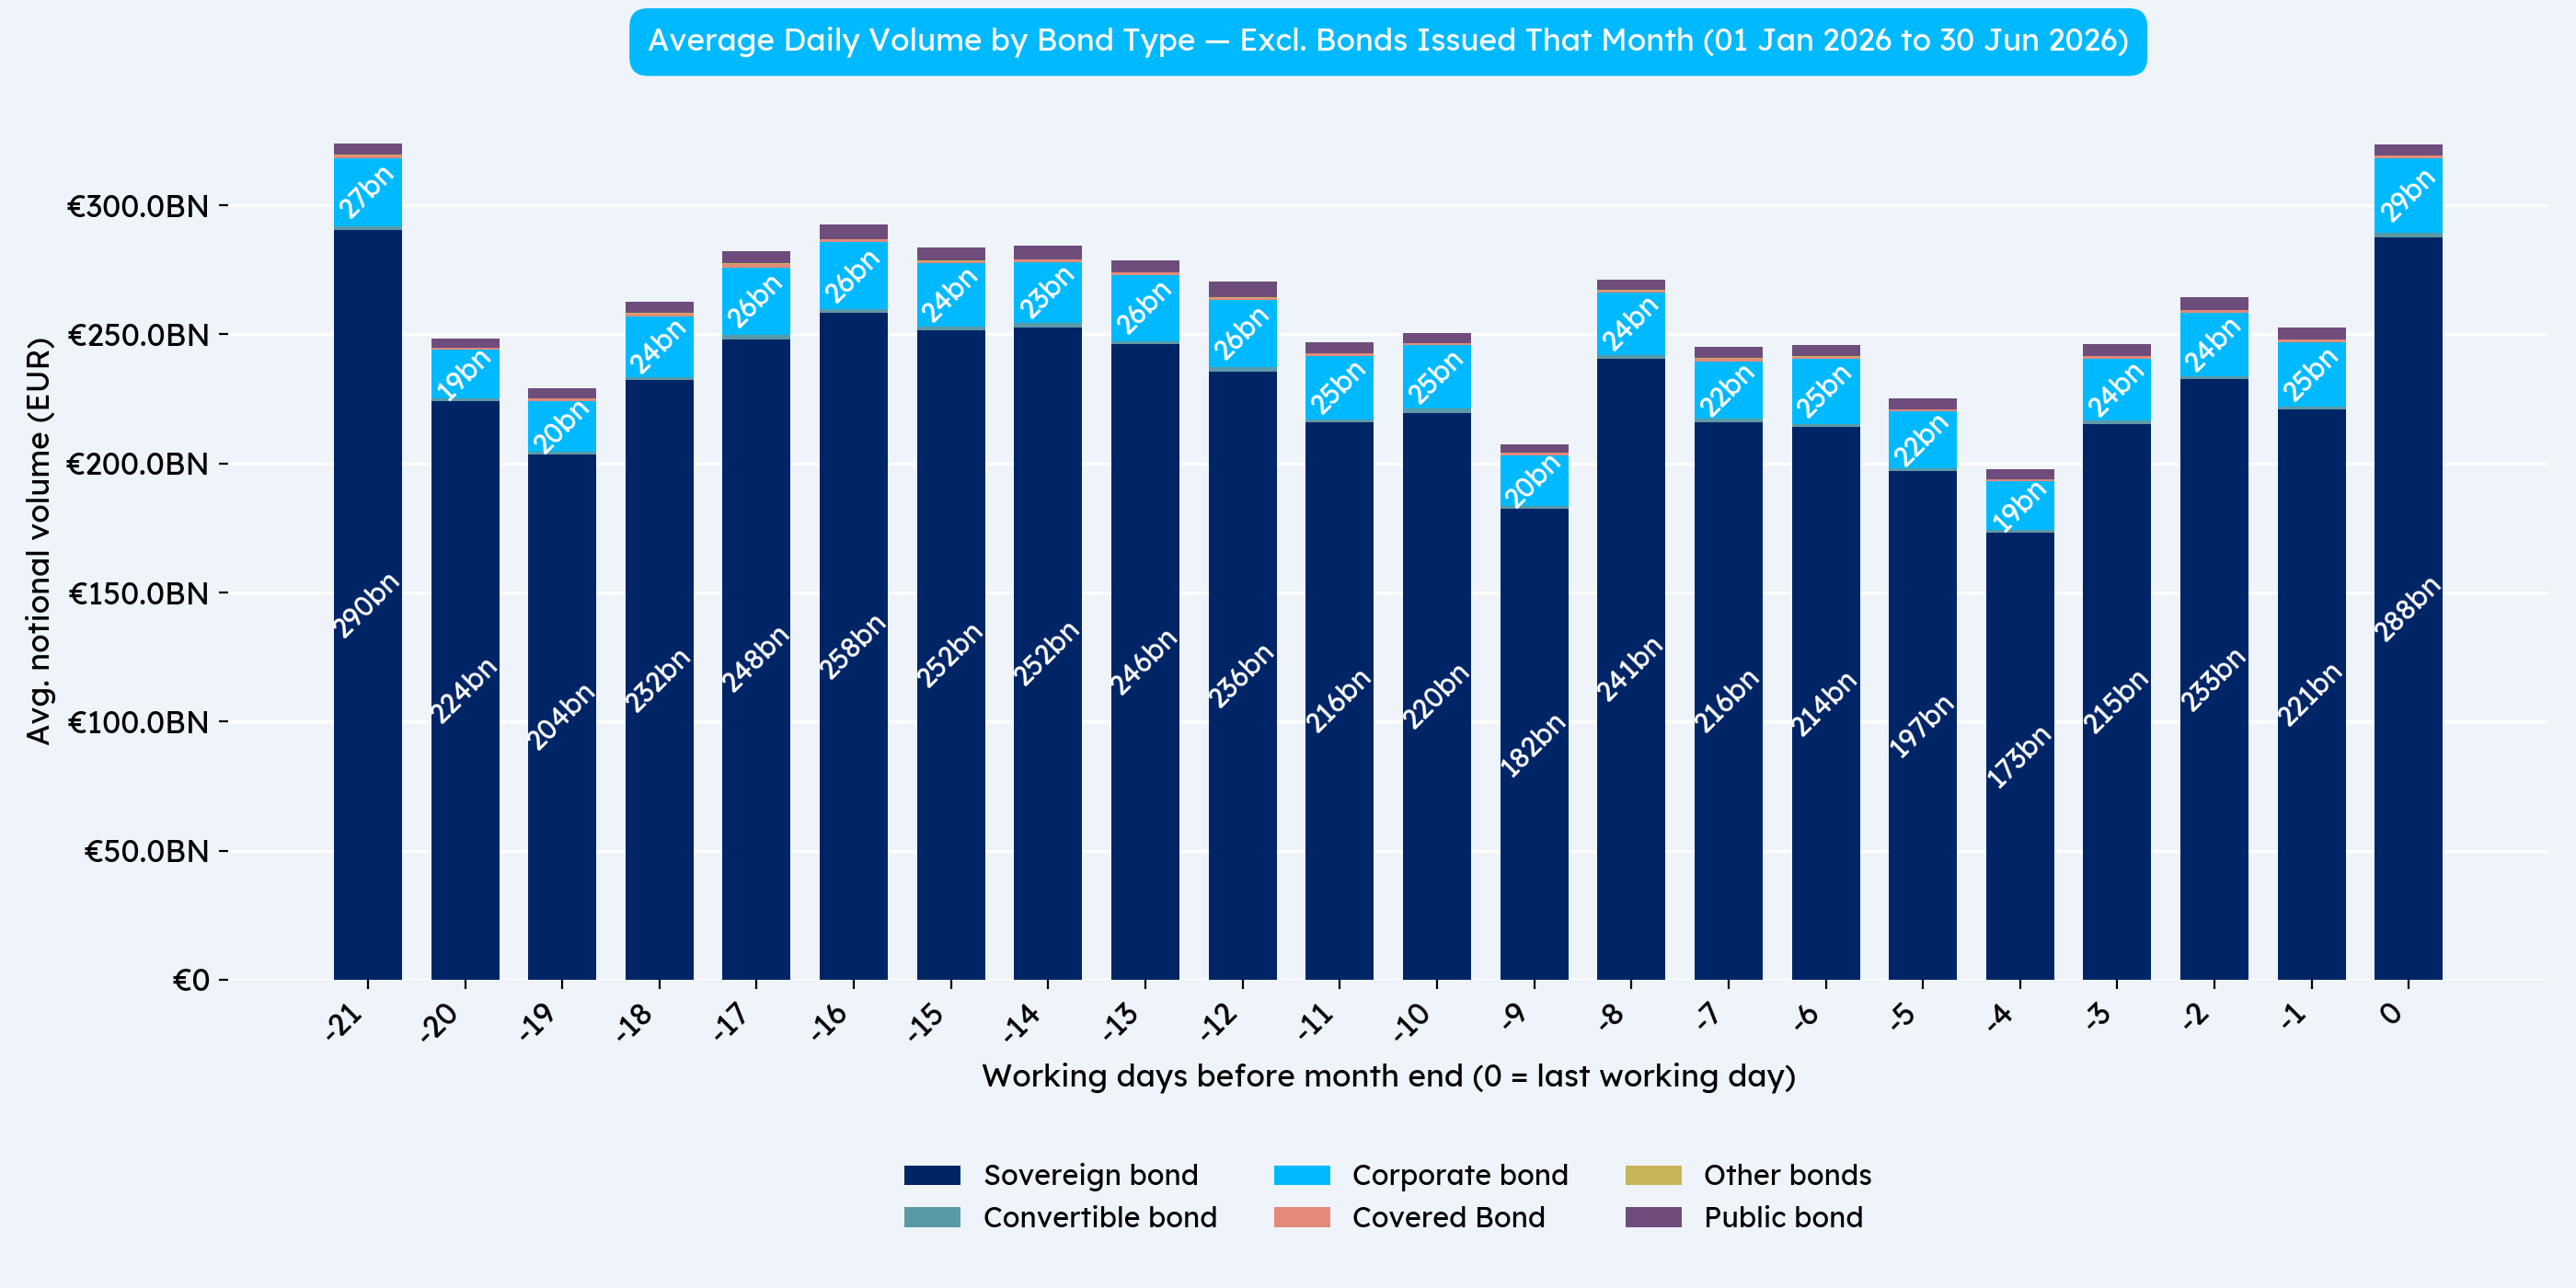
Chart 2 shows us something interesting and unexpected. Even removing new issues the flow, whilst slightly more pronounced is not as heavily skewed towards month end as might be expected.
Finally we focus on corporate bonds (which is primarily to build on our analysis from Propellant Insights 38) and finish up this week grouping by time since first admission to a trading venue (used as a proxy for time since issue).
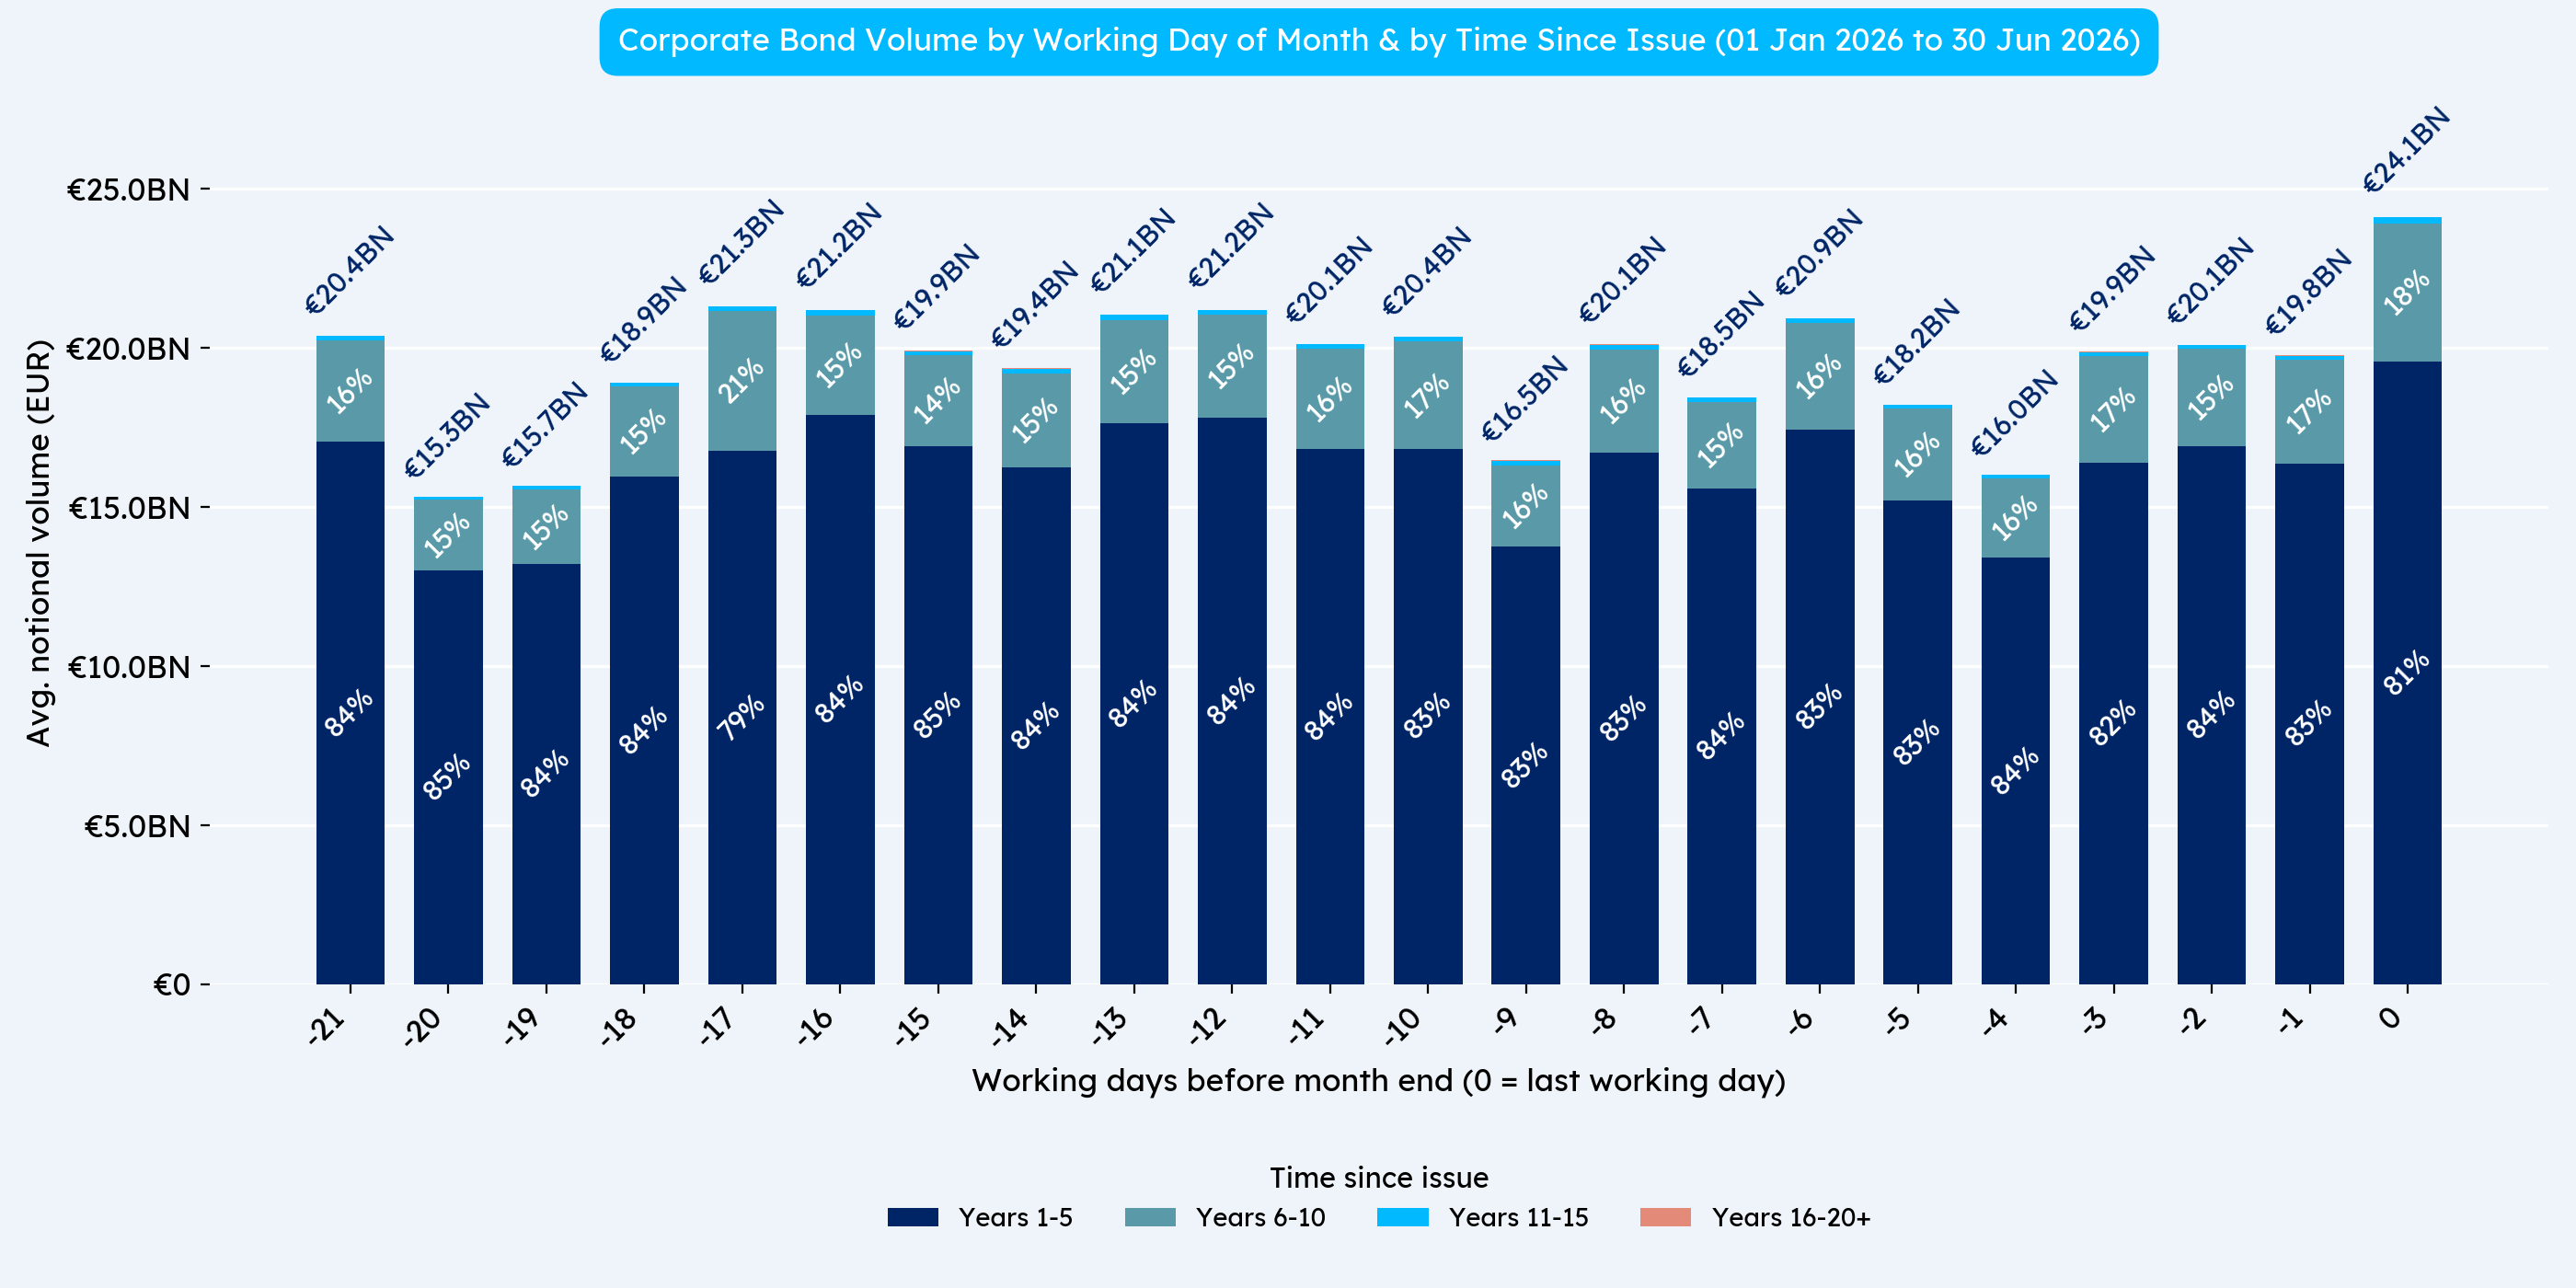
Chart 3 shows us that the vast majority of activity is in shorter-dated bonds. We expect this due to the reduced risk that these trade in larger sizes than longer dated bonds (of course these are also re-financed more frequently). Yet again with this view we see that whilst the amount of activity at month end is typically above average, the magnitude is not as large as anecdotal evidence would suggest.
“It is worth pointing out that not all months have the same number of trading days due to shorter months and public holidays. This may affect and skew the average trading volumes seen at the beginning of the month in the charts.
Let us know if these results align with what you would expect or if you have any comments and questions.”


Original photograph taken by Richard Hadley
Dan Barnes - Dan is a highly experienced market commentator and founder of multiple media ventures including Trader TV and The Desk.
He is contributing as a guest editor for Propellant Insights ahead of starting a new venture in Q4 this year.
Vidal Mehra - Vidal is Chief Product Officer for Propellant Digital and the lead author for Propellant Insights.
He has been working with financial institutions for over 20 years across multiple disciplines including front office and consulting roles.

Helena Roughton - Helena recently joined the team as a Product Manager, bringing extensive MiFID policy experience having previously worked at AFME.
She also brings product remediation and data analysis experience from the Bank of New Zealand.

%20(10).png)
%20(9).png)