
%20(4).png)
Germany is one of the largest issuers in the European Government Bond space, but with over EUR 40 billion traded in the secondary credit markets each month, and a fifth of that in USD, does this activity go under the radar?


Firstly, we take a look at the overall EUR and USD volumes (acknowledging no EUR transactions are reported via TRACE), and compare MiFID vs TRACE for 2026 year-to-date.
As market participants would expect, given the size of German EUR corporate issuance, Chart 1 shows that the volumes disseminated via MiFID are vastly higher than those published via TRACE, with MiFID volumes making up between 76-80% of the combined USD (equivalent) activity.
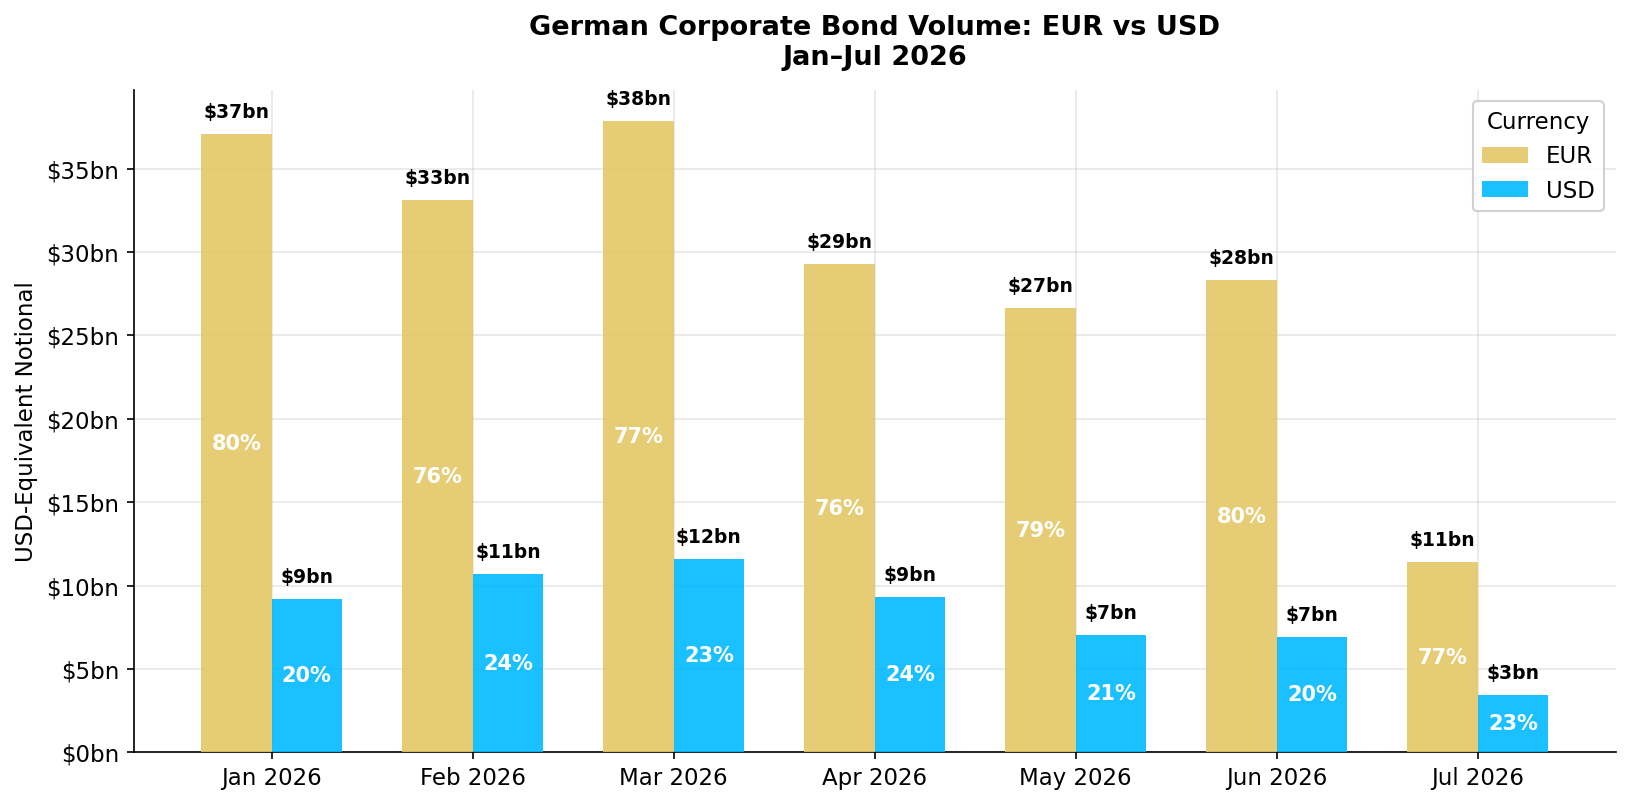
It is logical that the 22% of German corporate bond activity in USD would be concentrated within the US. This potentially has implications for disclosure under the US regime, instead of the EU regime. Hence, whilst Chart 1 is unlikely to raise many eyebrows, it is useful to be able to empirically demonstrate what many have long suspected (and highlight the proportion of EUR debt in USD equivalent).
In the next section, we dive deeper into the data, focusing on a smaller sample set, aiming to provide a like-for-like comparison on a subset of ISINs, as some (USD) ISINs will just trade in the US (and some potentially predominantly outside the US).
We now take a deeper look at the data and compare flows across ISINs that exist in both datasets. This allows us to gauge a true indication of the proportional volumes traded and reported within the MiFID and TRACE regimes, when comparing like-for-like, rather than overall volume.
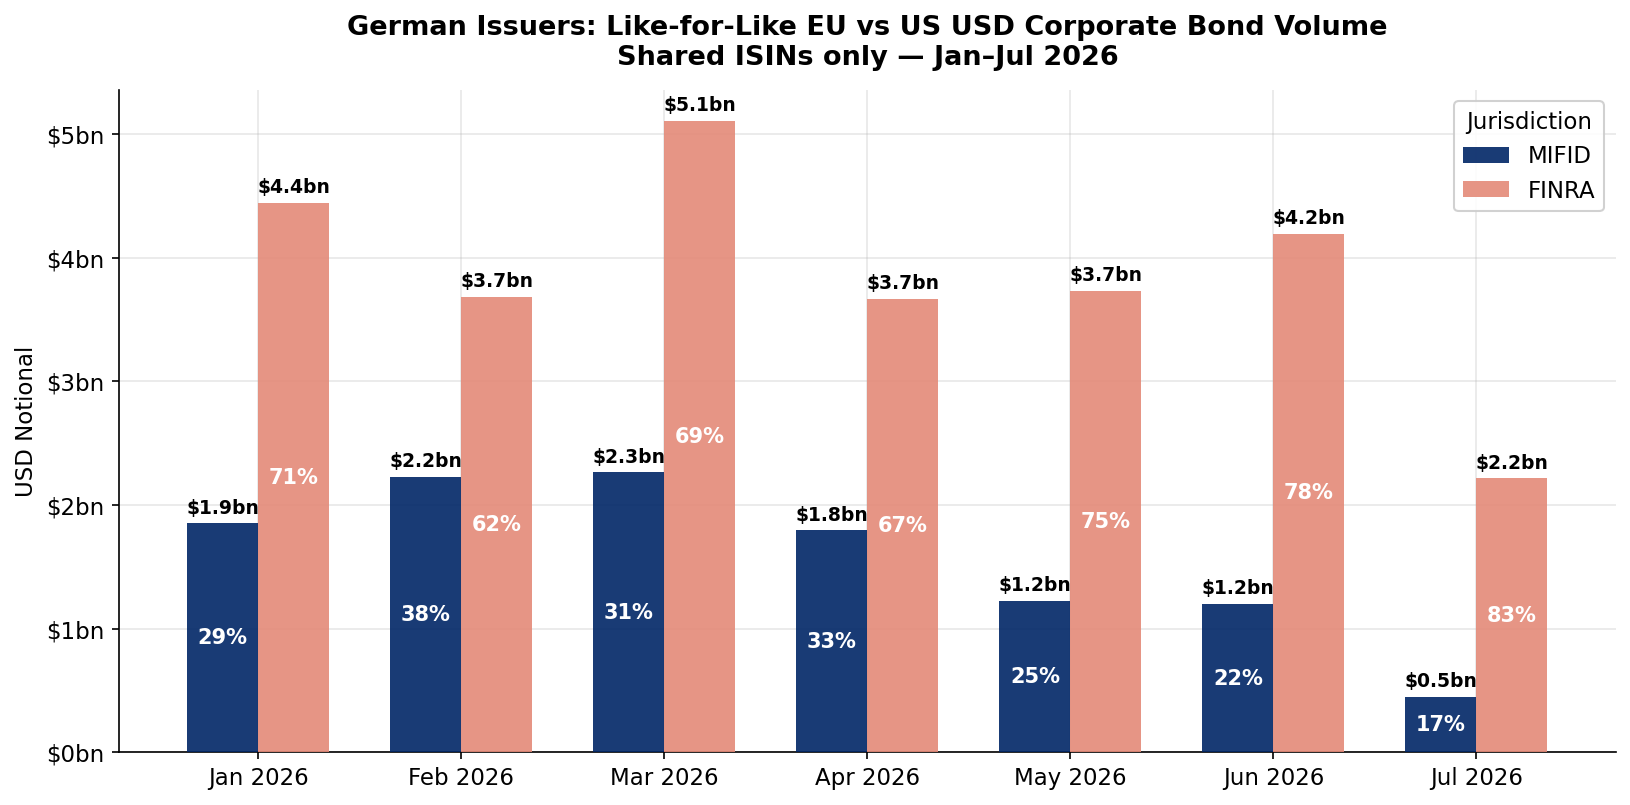
In Chart 2 we see volumes for ISINs denominated in USD and reported via both TRACE and MiFID are significantly higher in TRACE, although the proportion is highly volatile (with a range of 17%-38%). This confirms that the vast majority of German USD corporate bond activity is transacted in the US, even after removing ISINs that never trade in Europe.
Consequently, the proportion of German corporate USD bonds that are subject to TRACE reporting rather than MiFID reporting varies hugely month-to-month, complicating the ability to track buying and selling of a single issuer’s bonds.
Finally this week, we break out the 'capped' proportion of FINRA volume in Chart 3 below. Unlike MiFID, which either omits the volume or shows it in full, TRACE reports are capped at USD 5 MM for Investment Grade (IG) bonds and USD 1 MM for High Yield (HY) bonds with the true size held back.
Deferrals exist within MiFID, so if a trade for USD 10 MM on a liquid IG credit took place in Europe, the trade would likely print with the volume omitted on T+1, and then one week later a subsequent report would be released containing the volume. TRACE takes a different approach, instead unmasking the volume on any capped trades only after six months.
With a sizeable proportion of volume capped, the percentage of German USD corporate activity occurring in the US is likely to be even larger than suggested in Charts 1 and 2.
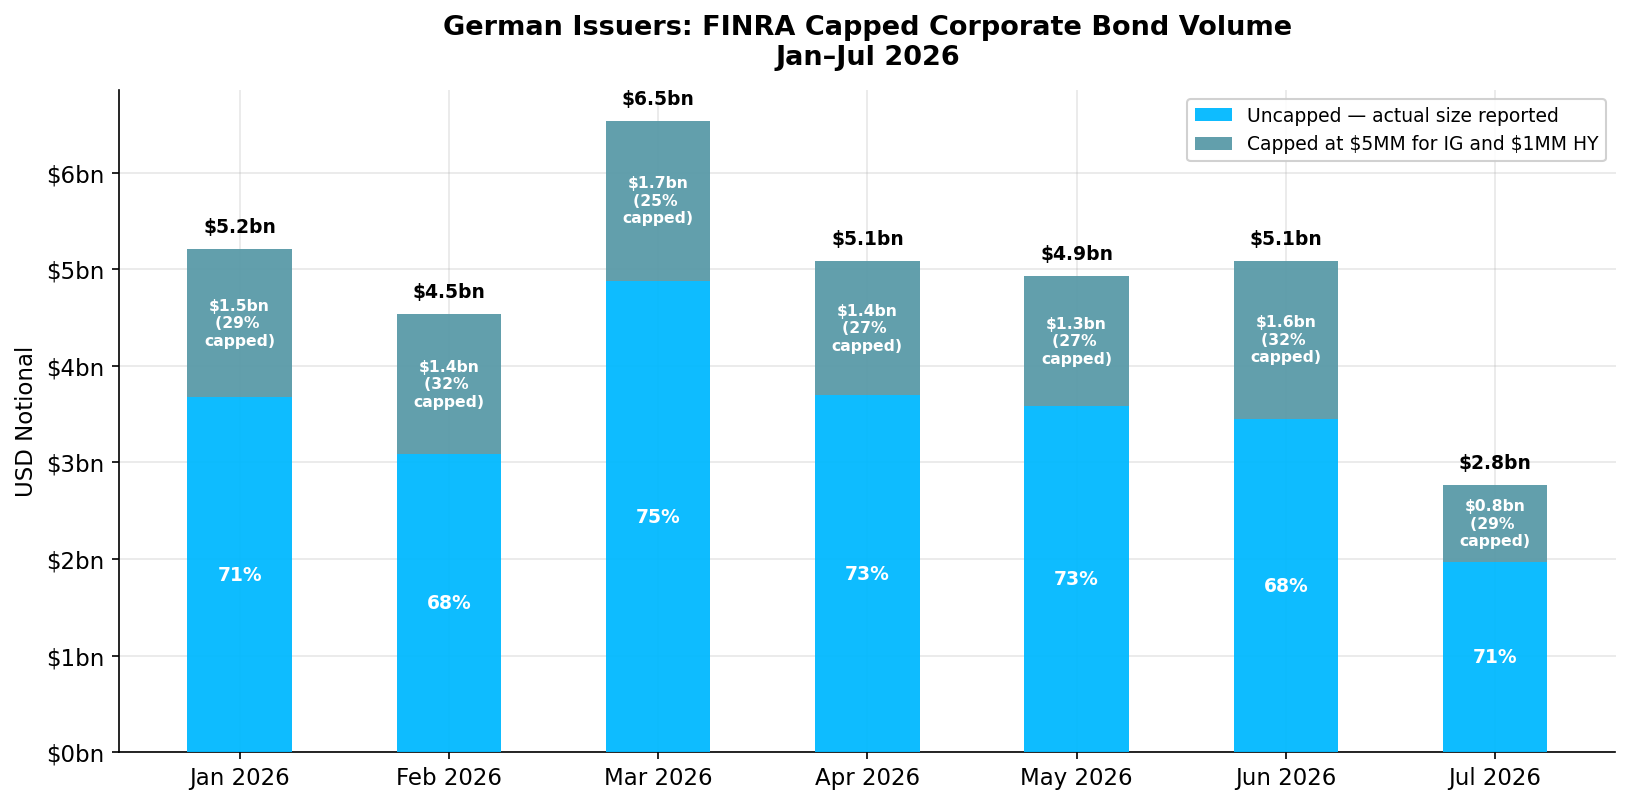
“Capped volumes under TRACE represent 6% of German Corporate Bond volumes on average. Additionally, the ESMA framework defers some reports for four weeks, and the FCA up to three months, all of which are for the largest trade sizes. Additional trades will therefore still be outstanding in the dataset.
On this basis, any trader or portfolio manager following activity in a single issuer will need a full picture covering multi-market activity.”


Original photograph taken by Richard Hadley
Dan Barnes - Dan is a highly experienced market commentator and founder of multiple media ventures including Trader TV and The Desk.
He is contributing as a guest editor for Propellant Insights ahead of starting a new venture in Q4 this year.
Vidal Mehra - Vidal is Chief Product Officer for Propellant Digital and the lead author for Propellant Insights.
He has been working with financial institutions for over 20 years across multiple disciplines including front office and consulting roles.

Helena Roughton - Helena recently joined the team as a Product Manager, bringing extensive MiFID policy experience having previously worked at AFME.
She also brings product remediation and data analysis experience from the Bank of New Zealand.

%20(10).png)
%20(9).png)