

.png)
In recent months, portfolio trading has attracted increasing attention as its availability continues to expand. This week, we look into recent trends and examine whether the increasing focus is justified.
The core issues often cited surrounding package and portfolio trading are the definitions. We begin by outlining how these are defined, starting with the FCA1.
ESMA also defines both along similar lines, so we examine their similar (but subtly different) approach. Below ESMA defines both a package2 and portfolio trade3:
Comparing ESMA’s definitions above to FCA’s definitions on the previous page, it is evident that although they are similar, with just some subtle differences. In practice market participants tend to interpret the regulatory definitions as if they were the same, so to some degree there is a harmonisation of treatment across the EU and UK.
One interesting quirk is that for a package transaction, both ESMA4 and the FCA1 permit the entire package to be deferred based on the instrument within the package with the longest deferral. This contrasts to the portfolio trade treatment, which states that each line item should be booked (and deferred or not) based on the individual trade characteristics.
So far, we have considered the regulatory definitions of both package and portfolio transactions. We now turn to our real-world observations.
Chart 1 below presents the average transaction size for sovereign bond transactions (in EUR equivalent), comparing portfolio and package line items to regular trades.
.png)
Whilst portfolio trade line items initially start off much smaller, there is an observable convergence, with trade sizes for all three categories trending to approximately 400k. The analysis then extends to corporate bonds to assess if a similar trend can be observed.
.png)
Interestingly, Chart 2 shows there has been almost no change in transaction size throughout 2025 and early 2026. The portfolio transaction line item size is slightly larger than for packages and single trades, but only in the region of 50k, which is not generally considered significant. It is apparent that the median size for sovereign transactions is almost double that of the typical corporate bond transaction size, which is not illogical as sovereigns often trade in much larger size.
Moving on from the average size, we now look to see if there have been any obvious changes between the first quarter in 2025 to the first quarter of the current year (2026). The data is segmented by regulatory jurisdiction, initially focusing on trades reported under the ESMA regime.
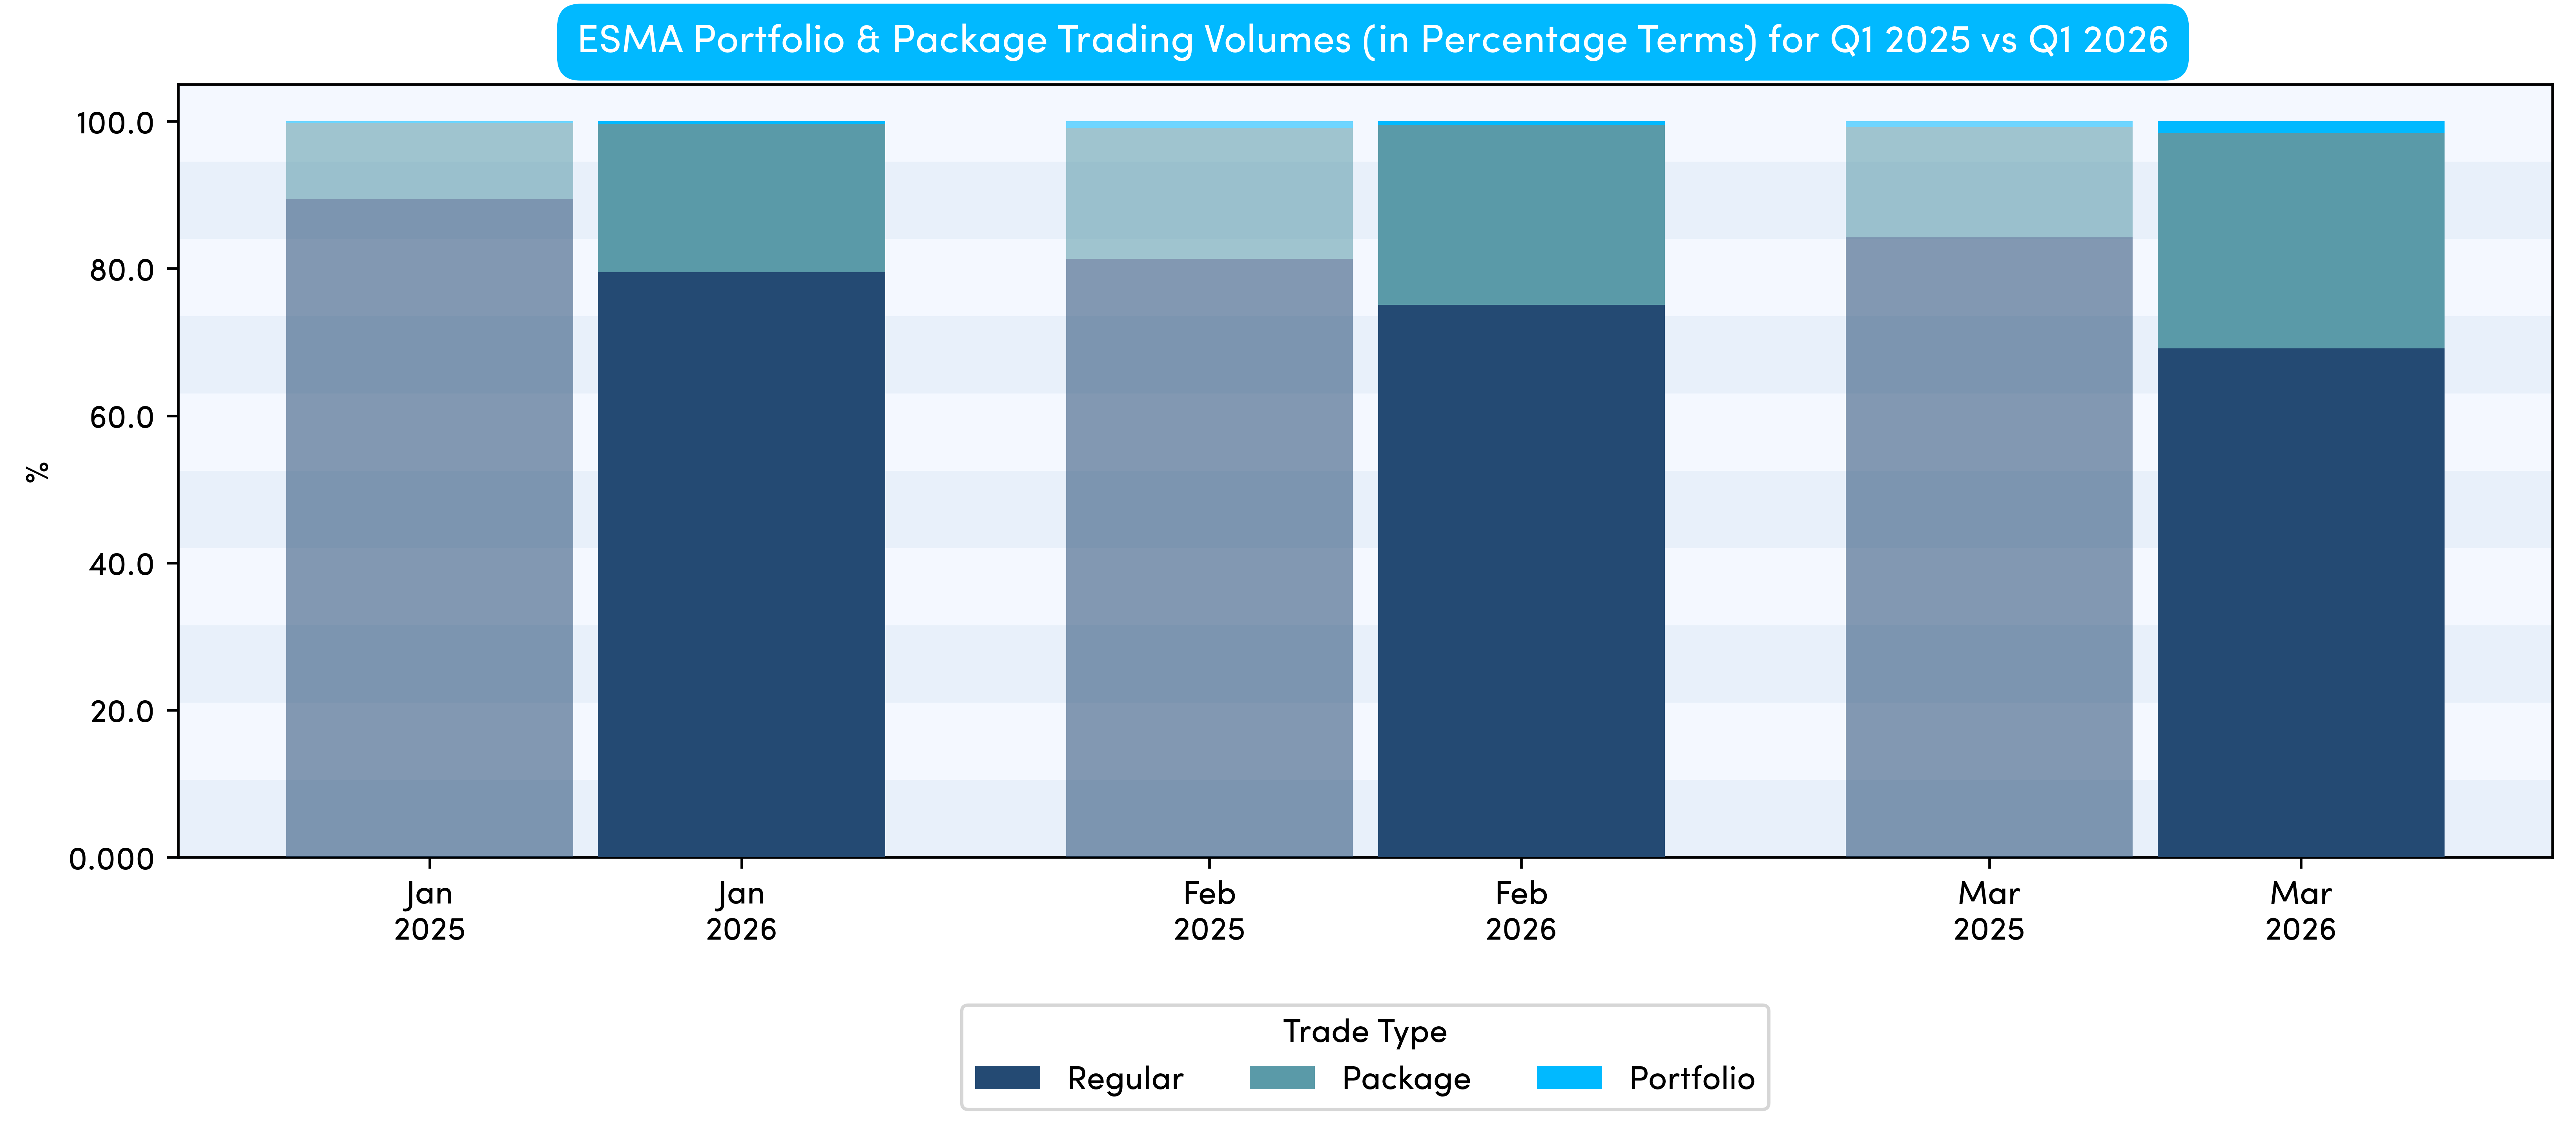
Chart 3 is arguably the most telling so far, showing a clear increase in volumes for each month in 2026 compared with the same months in 2025. It is therefore useful to consider the FCA data to see if a similar trend exists.
.png)
We can see a very similar, if not more pronounced trend from the FCA data, with very limited portfolio trading activity showing in early 2025, only for both package and portfolio activity to significantly increase, to surprisingly high levels.
From the data, it suggests that package and portfolio trading activity (combined) is marginally more skewed (as a percentage of overall volumes) towards FCA venues, with a blended average of around 16% increasing to around 36% by the end of Q1 2026.
This is on the higher side of expectations (based on conversations with market participants). However, this can likely be explained by the lack of deferrals in the data. Larger trades are deferred by one day to three months under the new regimes, suggesting that the actual 2026 percentage will drop when this data is released.
Although we may have to wait to understand the precise percentage, the trend is clear, portfolio and package trading is here to stay and is becoming an increasingly important aspect of the Fixed Income ecosystem.
.png)
.png)
.png)