


This week, we take another look at Interest Rate Swap (IRS) volumes reported to the FCA, since the introduction of the new transparency changes.
It has already been established that real-time reported swap volumes are significantly higher than under the old rules, but this time we will also look into the distribution across the curves for three main currencies (EUR, GBP and USD).
A quick recap - What has changed for Swaps?
The new FCA transparency rules for OTC derivatives have narrowed the focus to three currencies: GBP, EUR and USD. Both spot- and forward-starting IRS transactions are in scope across the curve, so long as they reference SONIA (GBP), EURIBOR or ESTR (EUR) and SOFR or FEDFUNDS (USD). However due to the deferral rule changes, it is noticeable that the average deferral time has dropped (i.e. a significant proportion of activity is now reported within one business day, whereas previously the vast majority of transactions were reported after four weeks1).
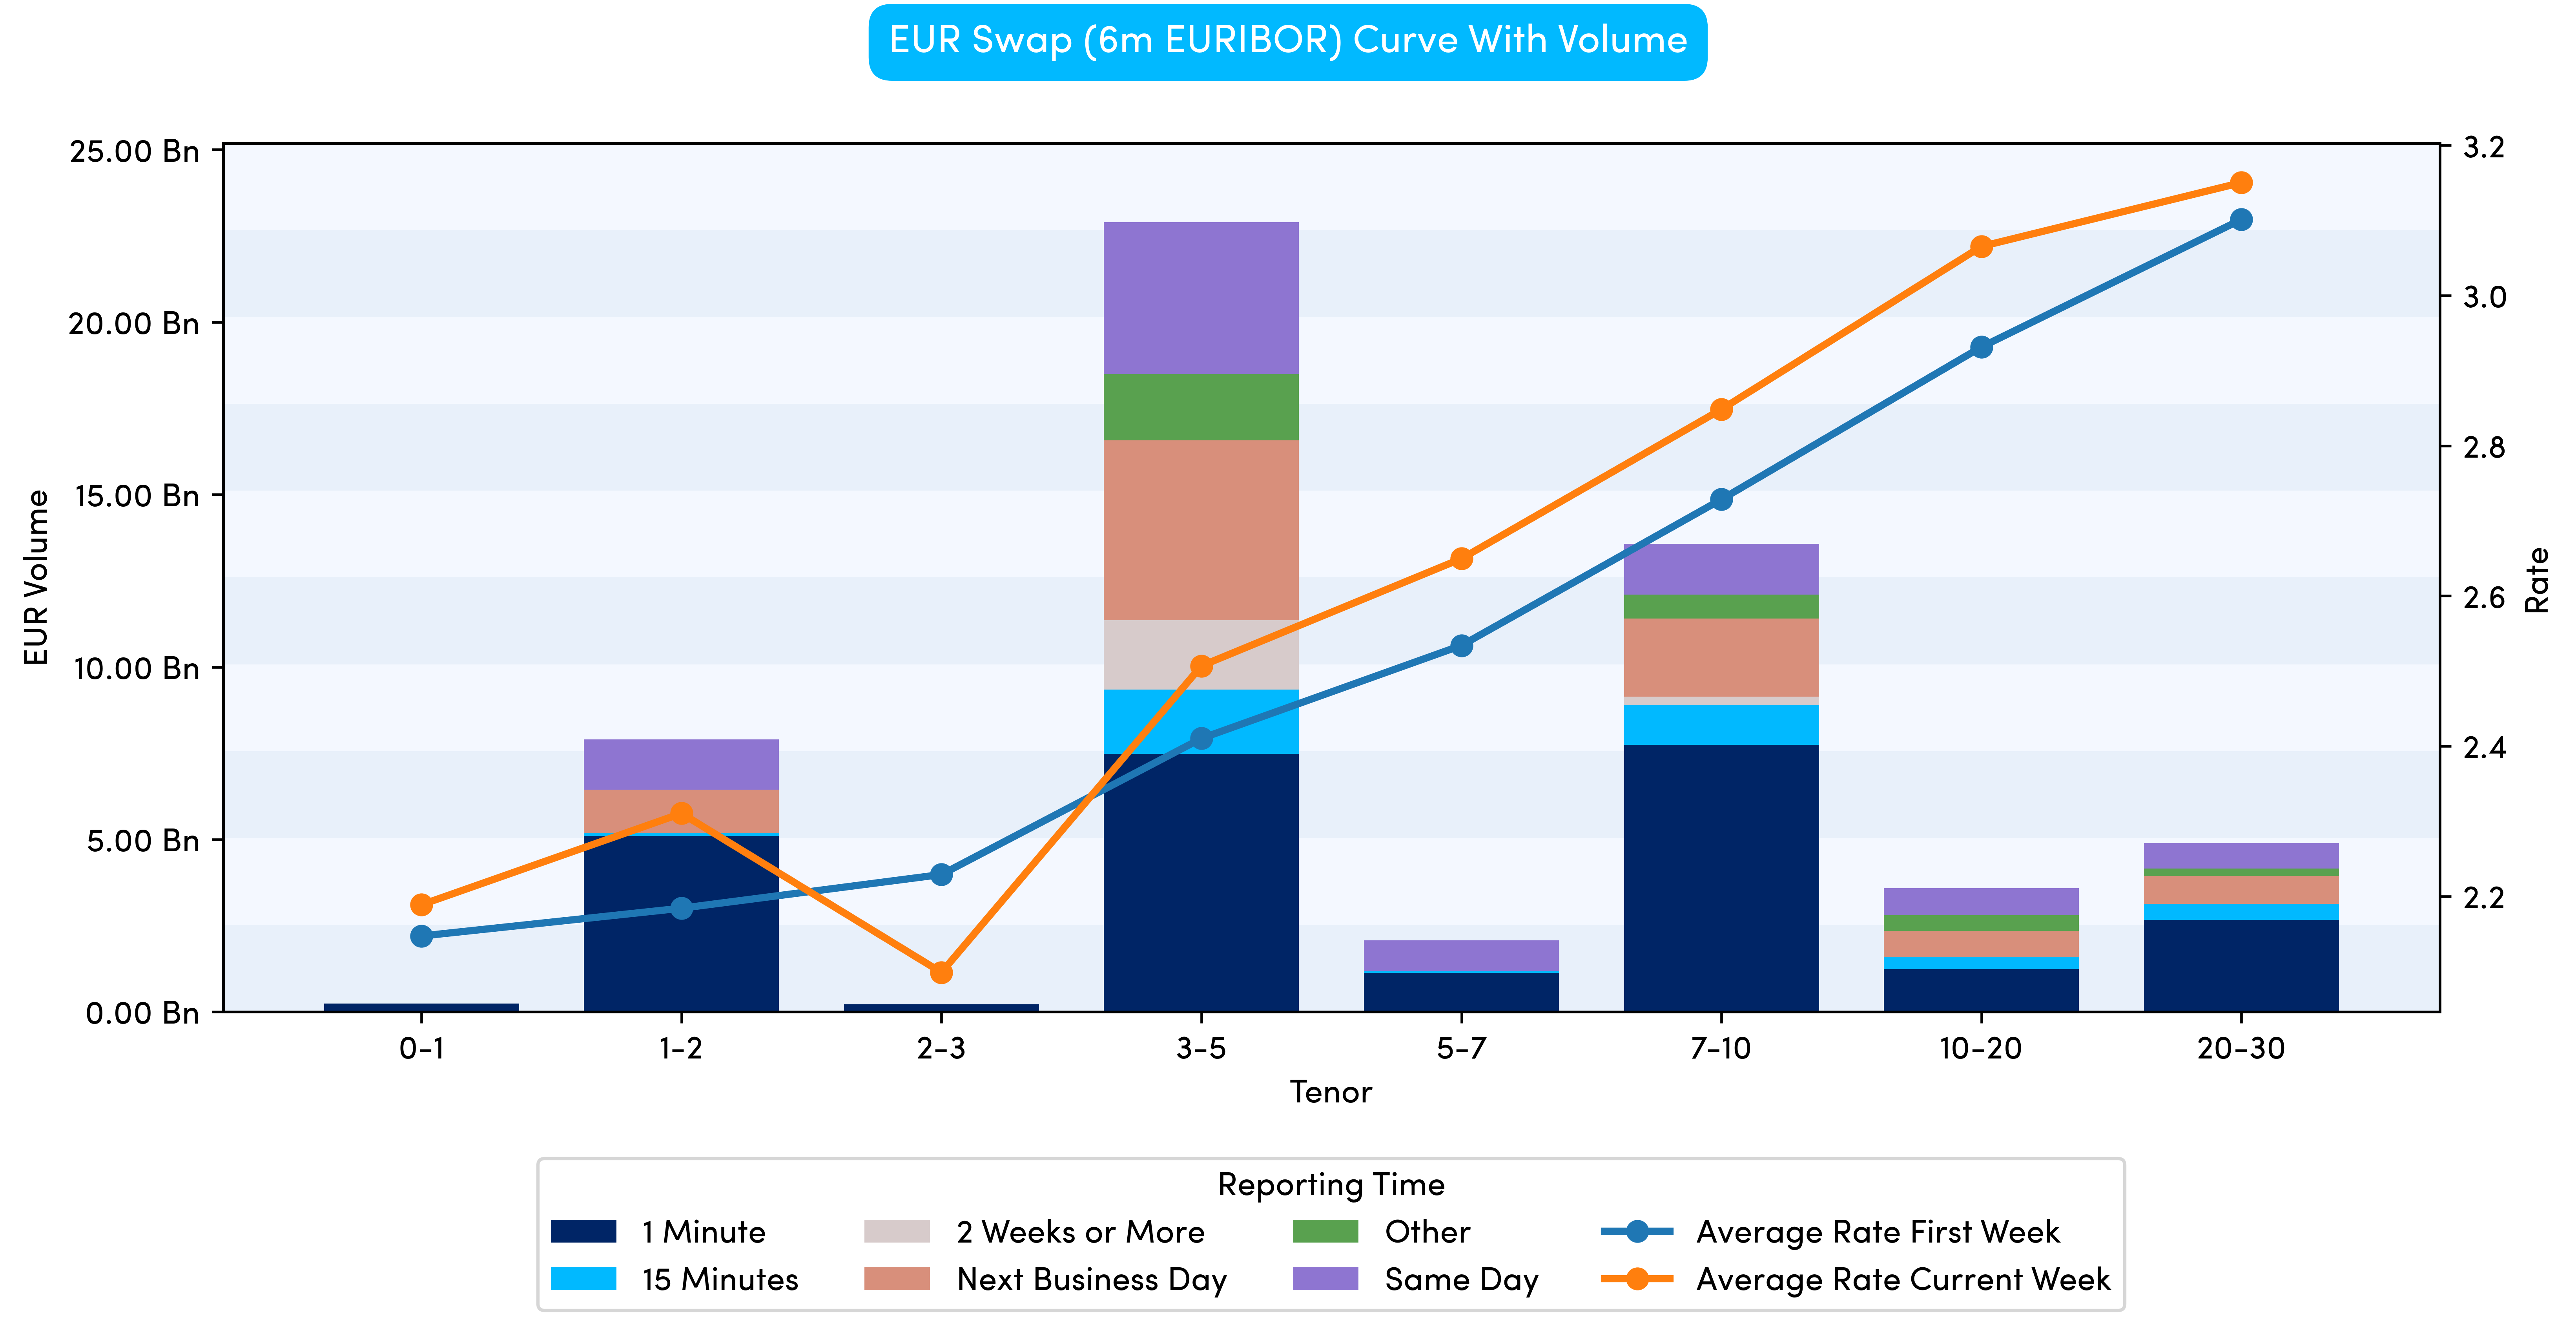
Aside from the deferral rules, the introduction of effective date and maturity date as mandatory reporting fields makes determining the contract tenor far more simplistic. These additions, along with switch from ISIN to Unique Product Identifier (UPI) have simplified the construction of swap curves. This can be seen in Chart 1, which presents the EUR swap curve.
With IRS contracts, an underlying reference rate determines how the payments on the floating leg should be calculated. When constructing a curve, it is important to use the same contract type for each tenor (otherwise we would not be comparing like-for-like). In order to determine the appropriate UPI, we first filter out any contracts that do not reference EURIBOR, SONIA or SOFR. Next, we group by UPI, reference rate and currency before summing the total volume (per UPI). Finally, for each currency, we can select the contract with the highest volume. This process gives us three UPIs that were used to create the EURIBOR, SONIA and SOFR curves.
What does the data show?
Looking at the EUR Swap data in Chart 1 (which uses 6-month EURIBOR as the reference rate), we can see flows are distributed across the curve, with the bulk of flow between 3 and 10 years (purely in terms of notional). The curve shape is fairly standard (i.e. steep) and it is apparent rates have risen slightly, particularly around the 3 year point.
Switching focus to the GBP curve (which uses SONIA), the pattern is very different. The curve remains steep (ignoring the front end), however the bulk of activity is heavily skewed towards the sub one year bucket.
This is unlikely to be a surprise for swaps traders as we are simply totalling the traded volumes (rather than using a metric such as the dollar value of 1 basis point, more commonly known as DV01). This means short dated flows (which have less risk due to the shorter contract length) typically trade in much larger size.
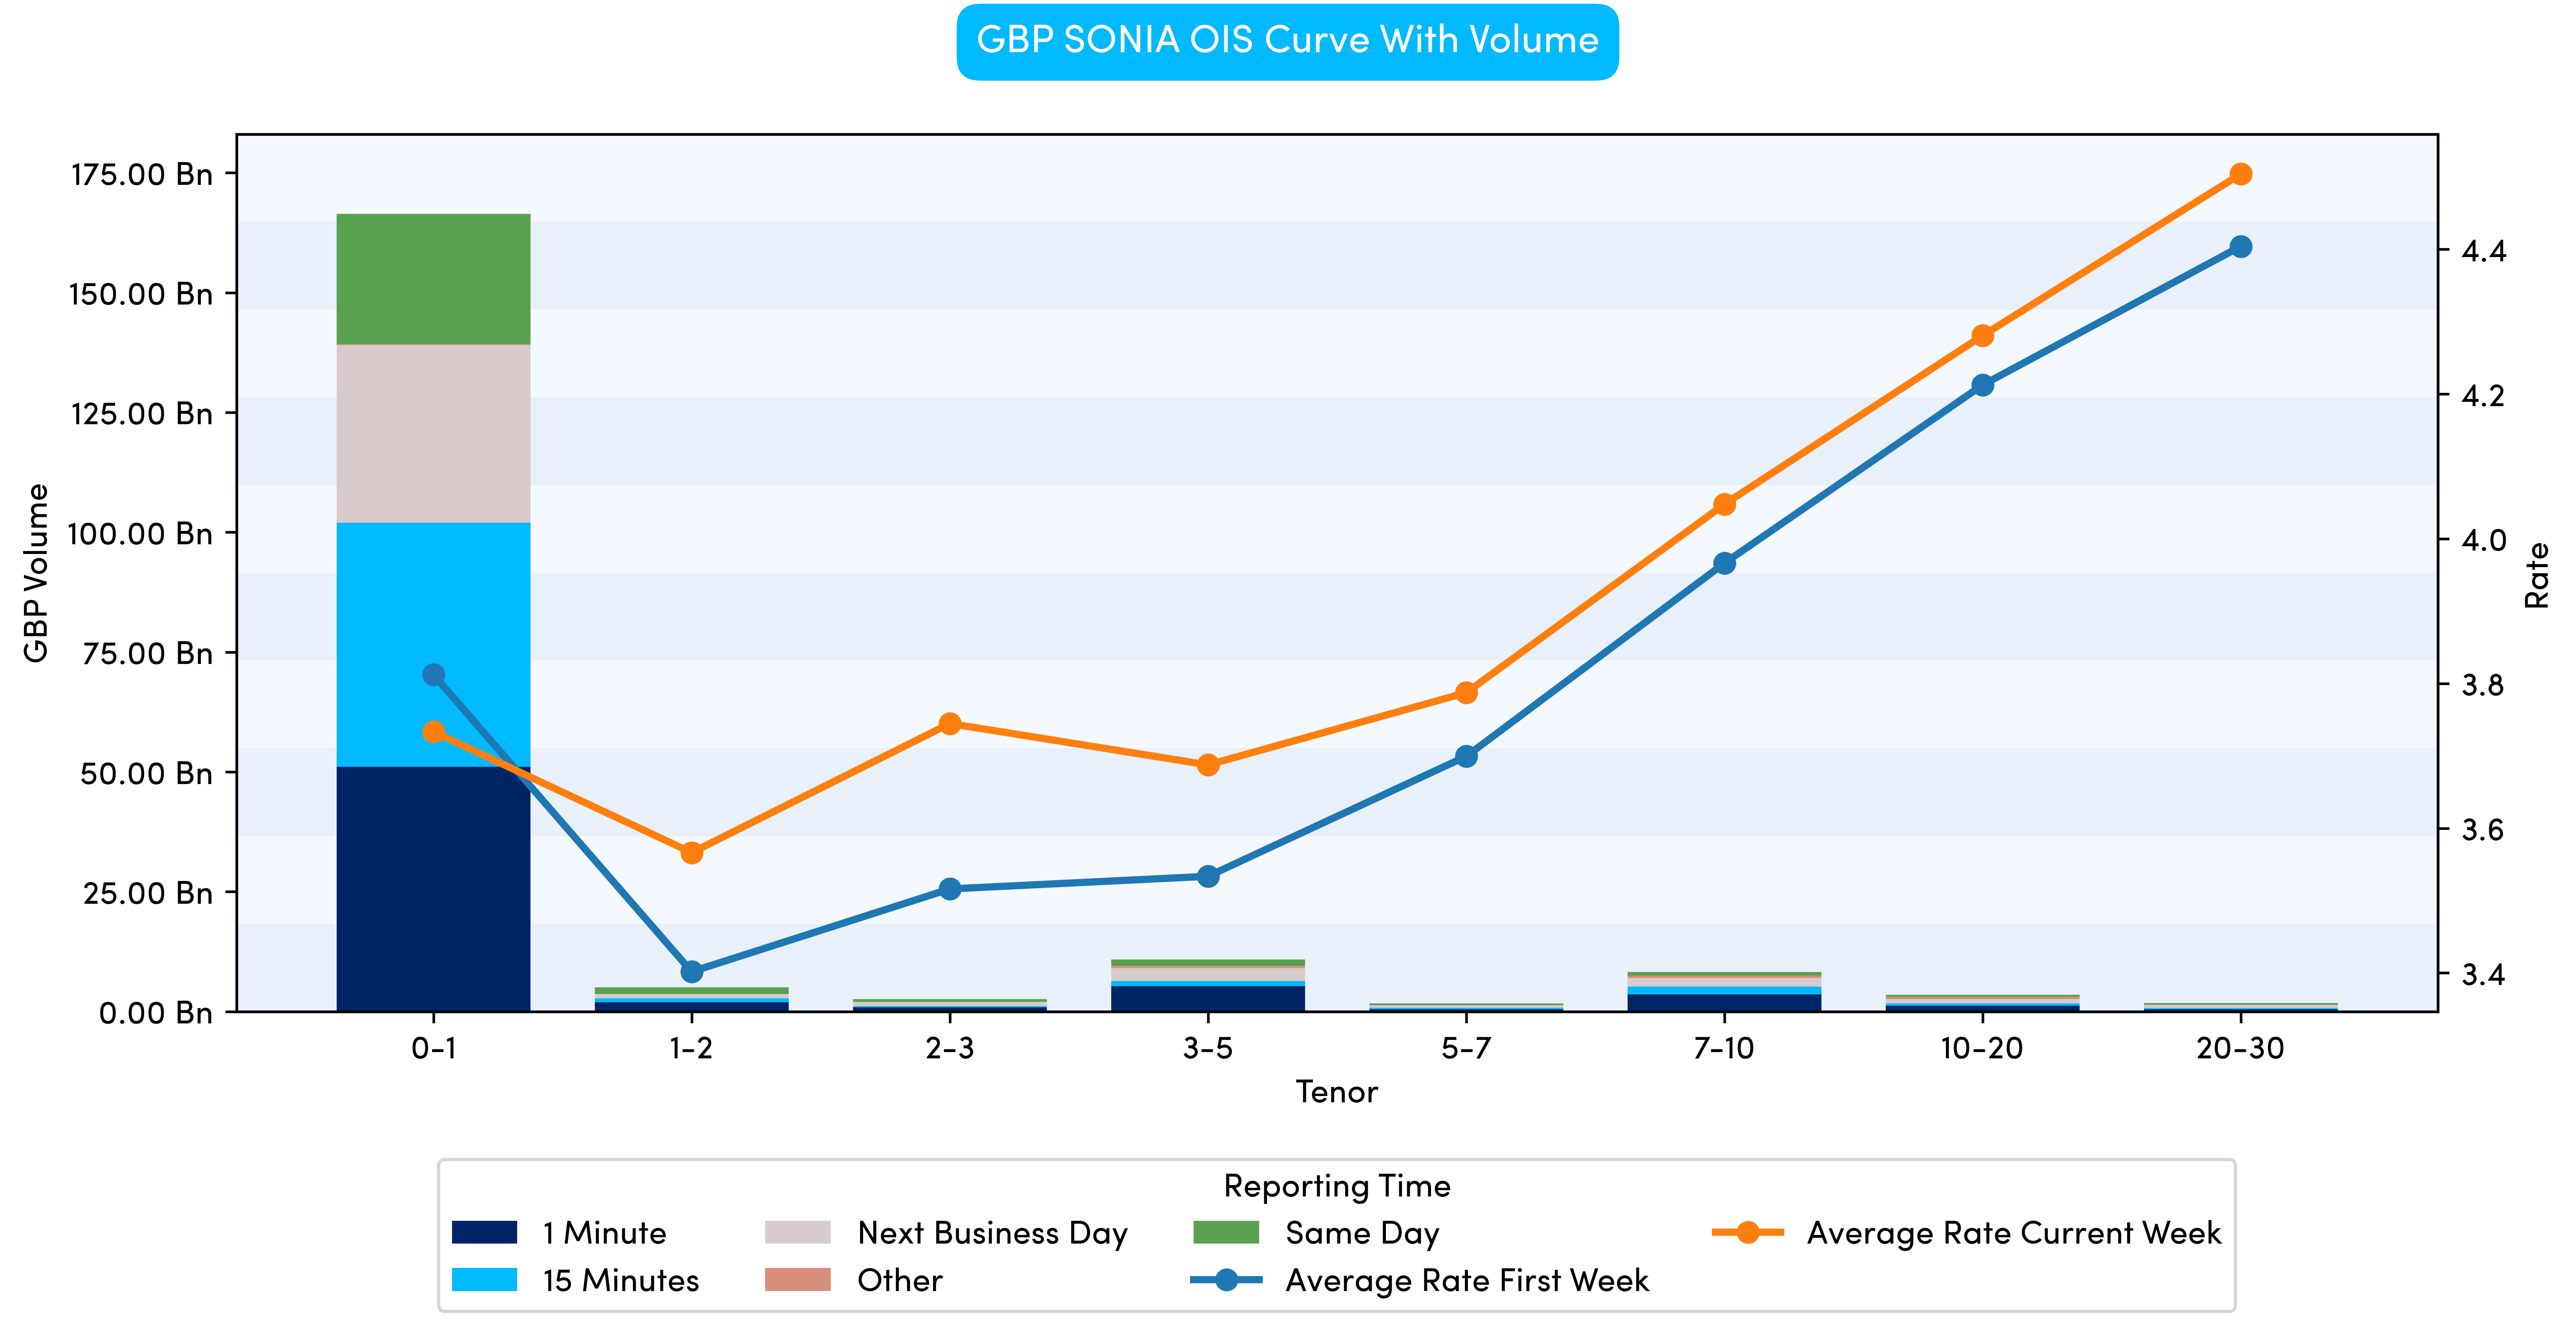
The FCA deferral limits reflect the change in risk as we progress along the curve. Using SONIA Overnight Index Swaps (OIS) as an example, the shortest duration bucket is 6 days to 3 months and trades falling into this category are real-time reportable up to a notional size of GBP 1.8 billion. If we look to the other end of the curve, the 30- to 50-year category, a trade larger than GBP 10 million would be deferred (i.e. not reported in real-time).
Given the way the deferral rules work, it is therefore likely that there will be additional volume to be disseminated, however we may not see all the activity until March 2026 (assuming the longest deferral period).
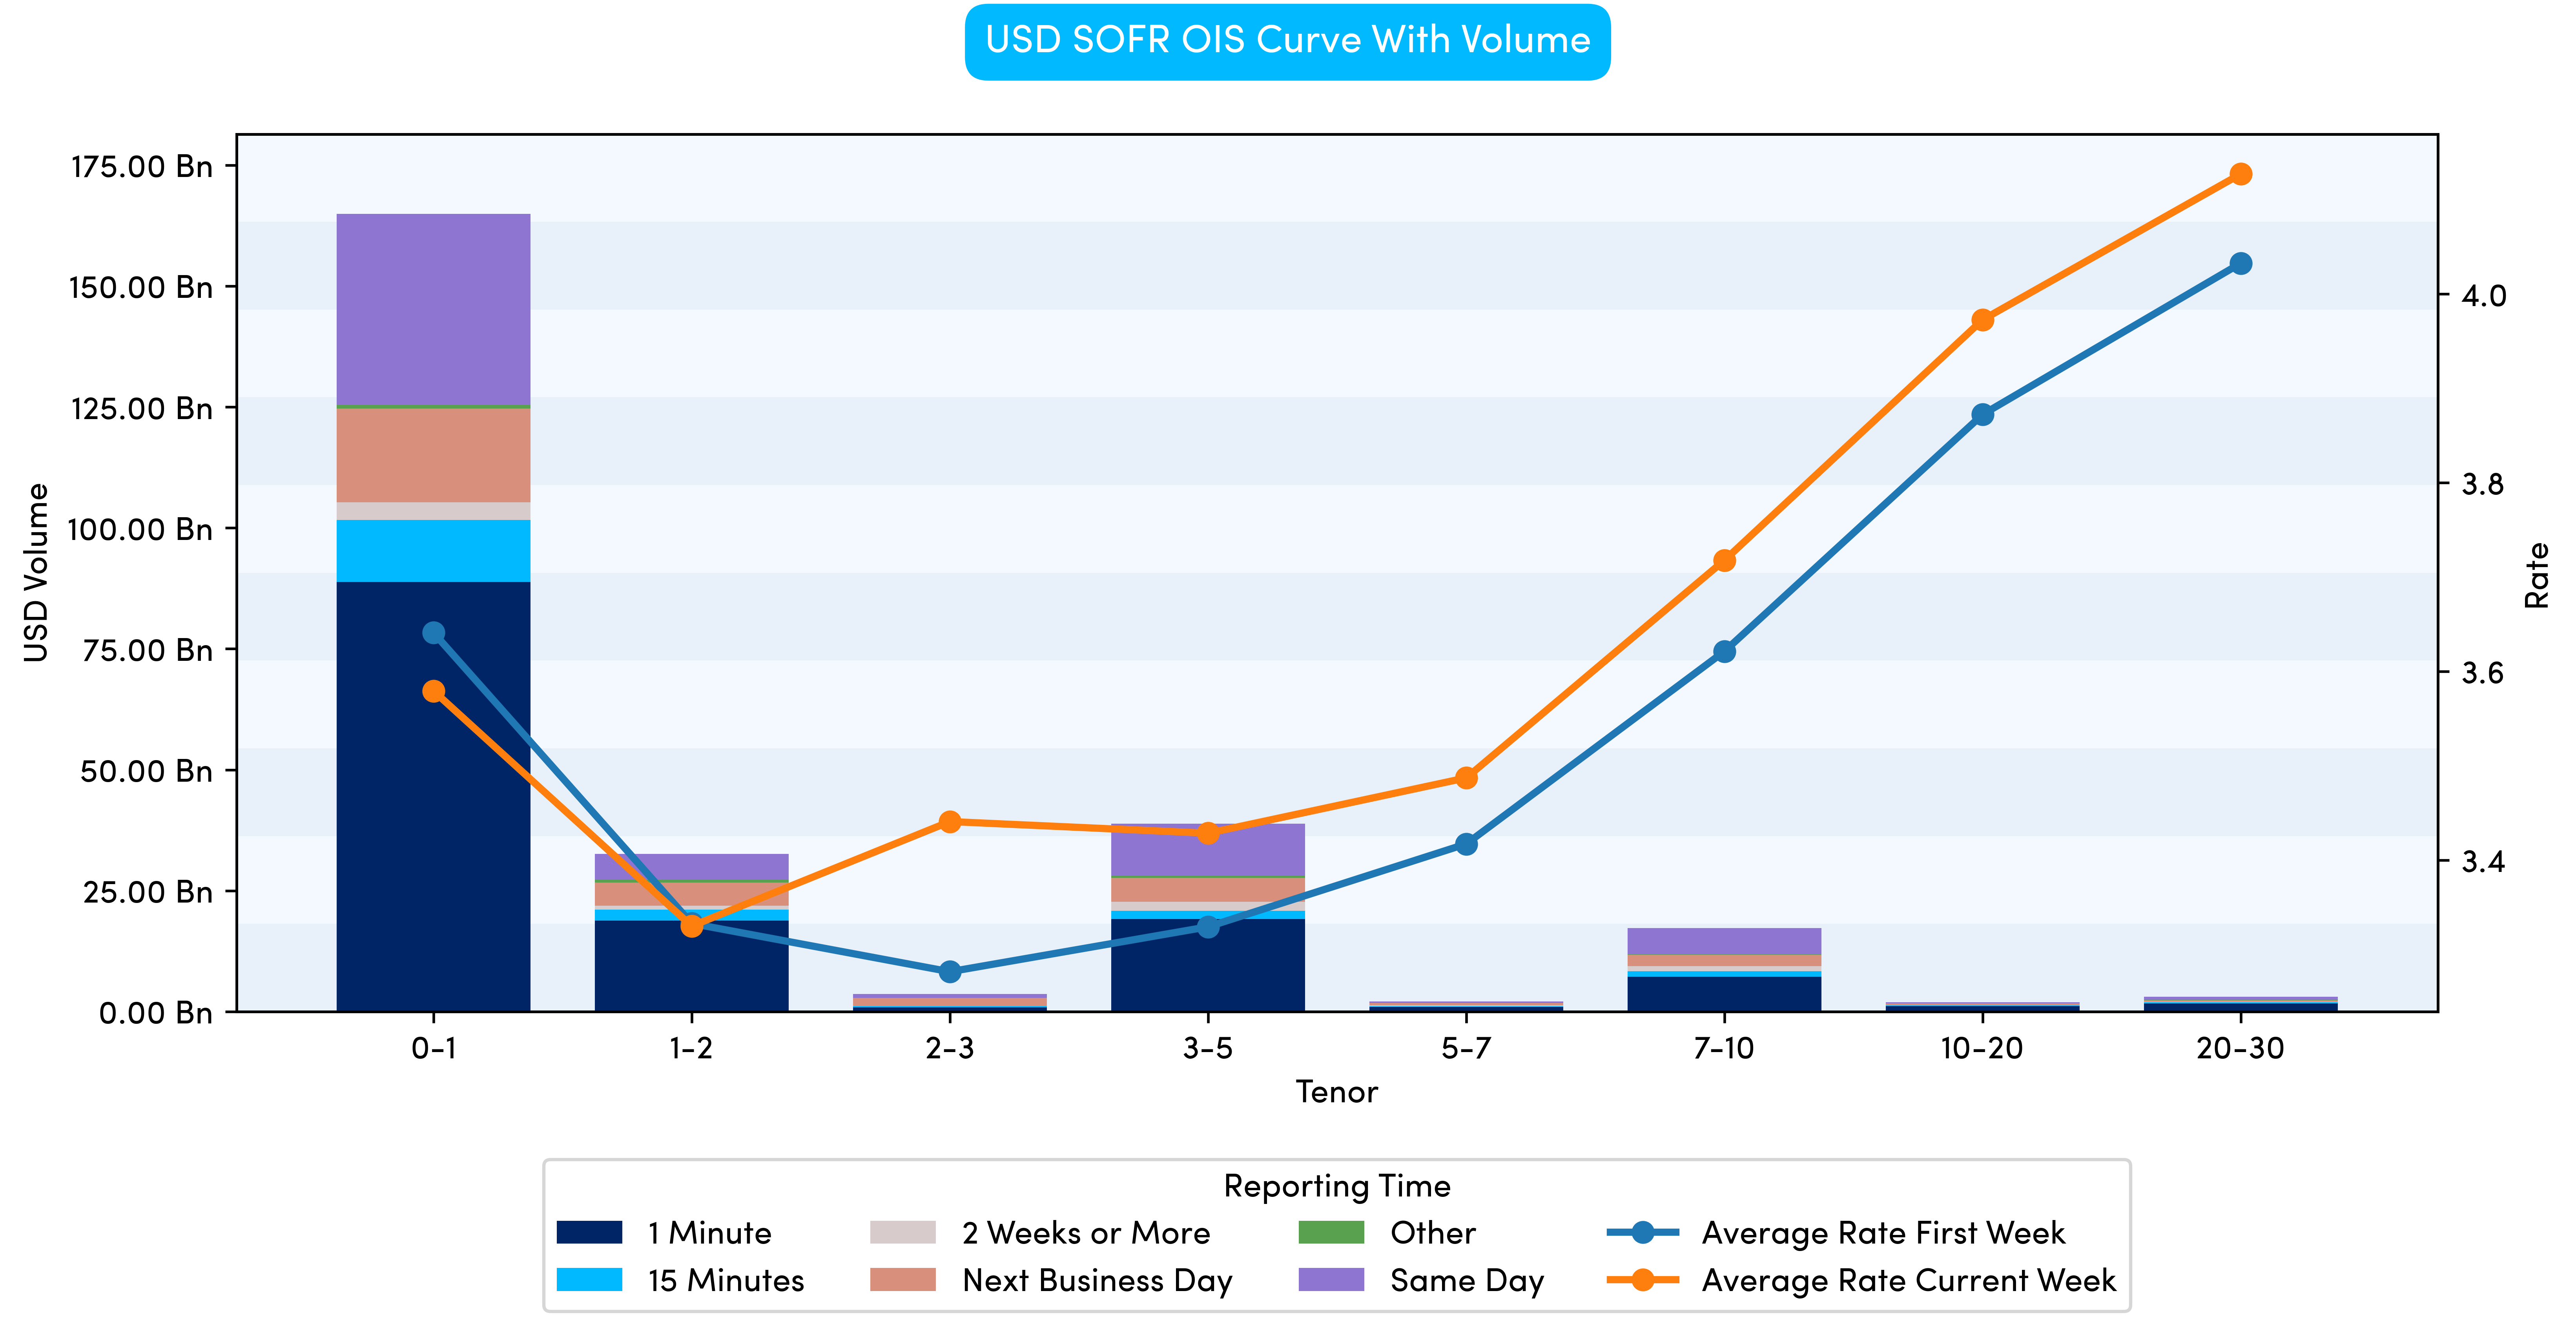
We finish with the USD SOFR curve and the story is somewhere in-between the EUR and GBP equivalents, with volumes skewed towards the front end like GBP, but with a different curve shape and reported flow distributed across the curve like EUR.
At Propellant Digital, we do not limit our analysis to MiFID data, we also focus on swap data reported under CFTC Part 43 (real-time reporting via Swap Data Repositories). Whilst a lot of USD SOFR activity trades on US Swap Execution Facilities (SEFs), significant volumes in other currencies (including EUR and GBP) also get reported via DTCC and the other SDRs. In 2026, we will continue to look at swap curves, incorporating the CFTC data, finding new and intuitive ways to look at flows across multiple maturity buckets and jurisdictions.
1https://www.clarusft.com/what-we-need-to-do-to-1 fix-mifid-ii-data/
.png)
.png)
.png)