

.png)
Given recent developments, it is timely to examine bond markets across the Middle East.
Our first challenge this week is to determine how we define the region, as varying definitions exist. Therefore to avoid confusion, we will use the original 10 constituents from the JP Morgan Middle East Composite Index (MECI)1.
Back in 2013 when the MECI was created, it comprised 10 constituent issuers, which form the basis of our analysis in this week’s issue. Those issuers were:
Chart 1 below illustrates hard currency debt (EUR and USD) issued by these nations. As expected, Israel and Saudi Arabia are by far the biggest issuers in USD/EUR debt. However, more surprising is the lack of USD-denominated debt issued by the UAE.
.png)
It might seem unusual to see such a small amount of activity on UAE debt; however this can be explained by two main reasons.
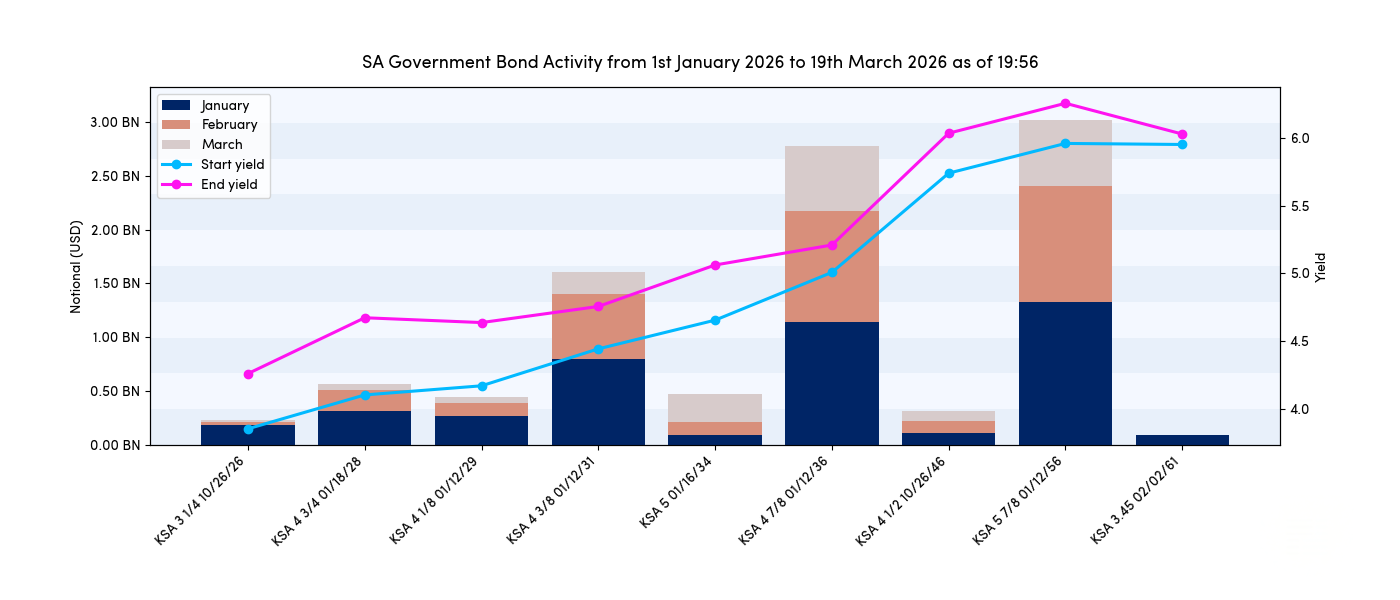
Abu Dhabi is fairly unique within the UAE, in the respect that it frequently issues in USD and has sufficient debt to have an active secondary market, with trades frequently reported under the MiFID regime. Chart 2 below shows the most active bonds on the yield curve for the Emirate since the start of 2026. March has been fairly active (as expected), and the curve has universally shifted upwards (unsurprising so).
.png)
Switching focus back to the wider region, we next take a look at the breakdown of debt, by issuance currency. The data indicates that the vast majority of sovereign debt is issued in USD, followed by Israeli Shekels, before a significant drop off to EUR, Saudi Riyal and finishing off with United Arab Emirates Dirham.
The currency split is noteworthy, and given some of the issuing entities, it may come as a surprise not to see more local currency debt (for example, Propellant Insights Issue 11 highlighted many more local currencies represented across the Asia Pacific region). This can be partly explained by the smaller number of countries in consideration here (10 in total), as well as by the fact that local currency debt often trades between local entities and therefore falls outside the scope of MiFID reporting.
Next, we examine the monthly flows, split based on real-time vs non-real-time reported under MiFID. We can see the vast majority of activity is actually reported in real-time.
It is important to note that we are only part way through March 2026, and as such, absolute volumes are expected to be lower at this stage. In addition, the new ESMA transparency regime only went live on 2nd March, meaning some activity may not yet captured due to deferrals. Furthermore, any trades in Q1 that fell into the FCA’s largest (three months) deferral bucket would also not yet be shown.
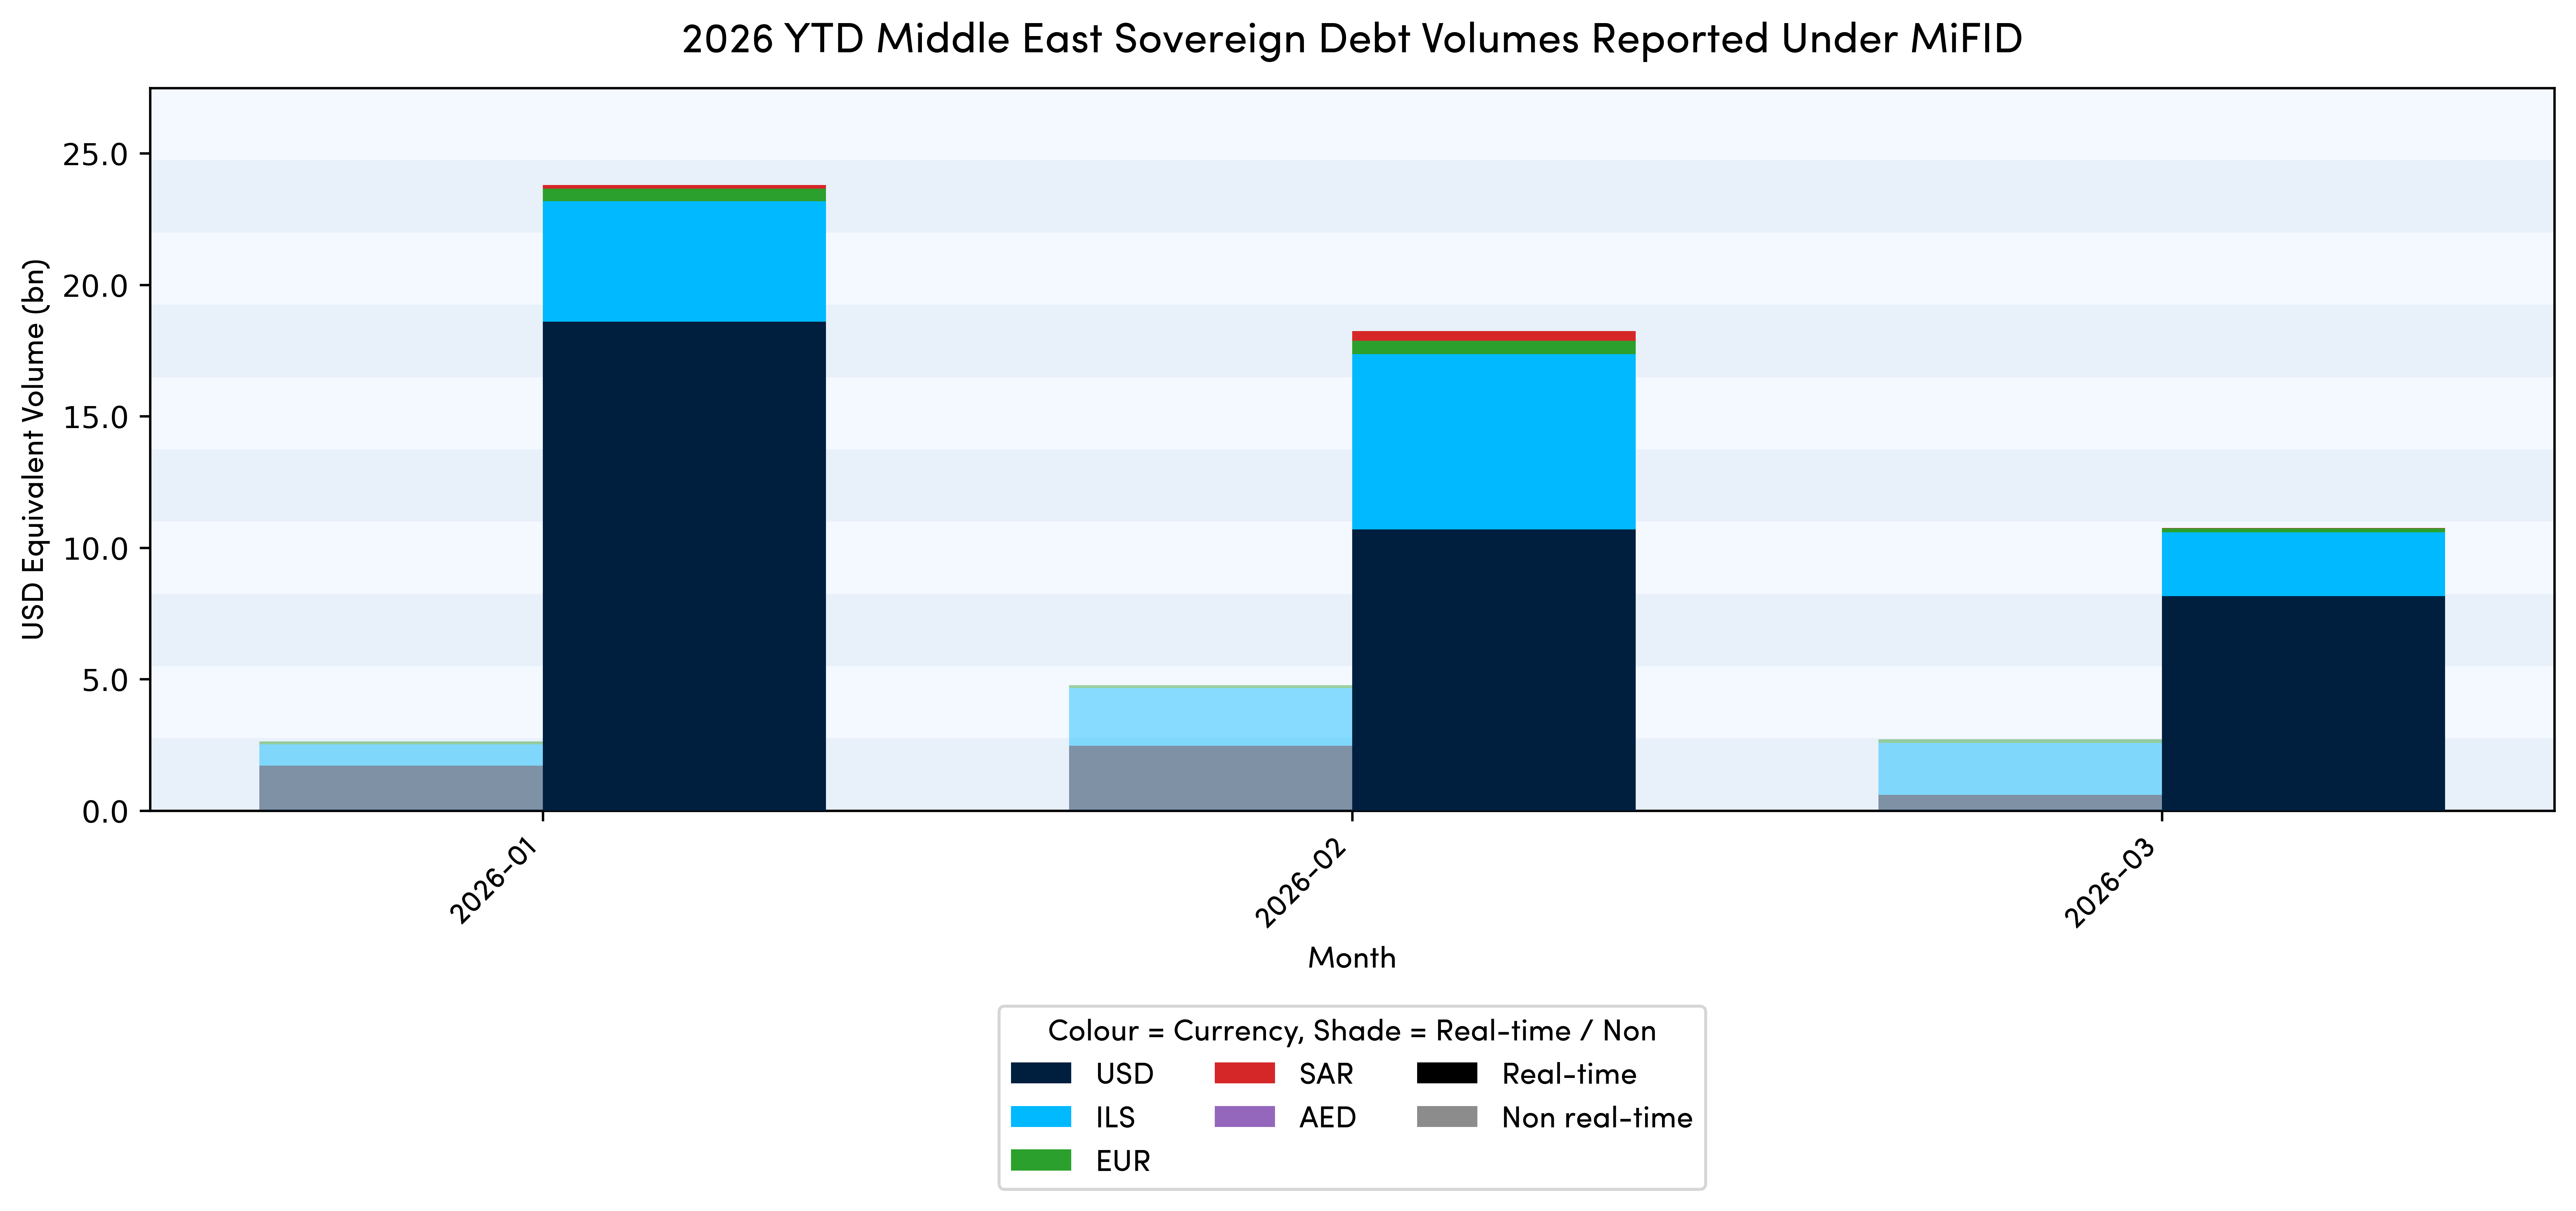
USD activity, as expected, makes up the vast majority of the flow, followed by ILS, with EUR coming a distant third in terms of monthly secondary volume.
From Chart 5, it is evident that Q1 2026 has been relatively active, which, given various tensions in the region, is to be expected. However, a deeper examination of the makeup of these flows, as shown in Chart 1, highlights one standout issuer: the Kingdom of Saudi Arabia.
We conclude this week’s analysis by considering the KSA (Kingdom of Saudi Arabia) yield curve (for international USD-denominated bonds).
KSA is the most active issuer in the region and accounts for largest share of secondary flow. As shown in Chart 5, and in line with other issuers in the region, the yield curve has shifted upwards. However, it is notable that volumes in March have been fairly muted.
Propellant will continue to analyse trends across Middle Eastern debt markets and provide further updates in due course.
.png)
.png)
.png)