%20(9).png)
Increased transparency in the US and European markets enables more precise investment and trading, but only where data is clean and reliable. Duplication of reports must be identified and weeded out. This week we look at USD activity reported out of the US and Europe to see not just what the overlap is, but to highlight where it occurs.


Comparing regulatory data sets can be difficult. The formats typically differ and there is often ‘noise’ (this can take many forms, e.g. portfolio trades or non-price forming transactions).
For these reasons, whenever more than one dataset is used, it is always necessary to de-duplicate the data, otherwise it would lead to double counting and this would inflate the estimated notional volumes traded over the period in question.
There is always a degree of subjectivity in this process and as different regulatory regimes have different rules, it seems likely this will be the case for the foreseable future, however with a few logical steps we can derive a result with a reasonable degree of confidence.
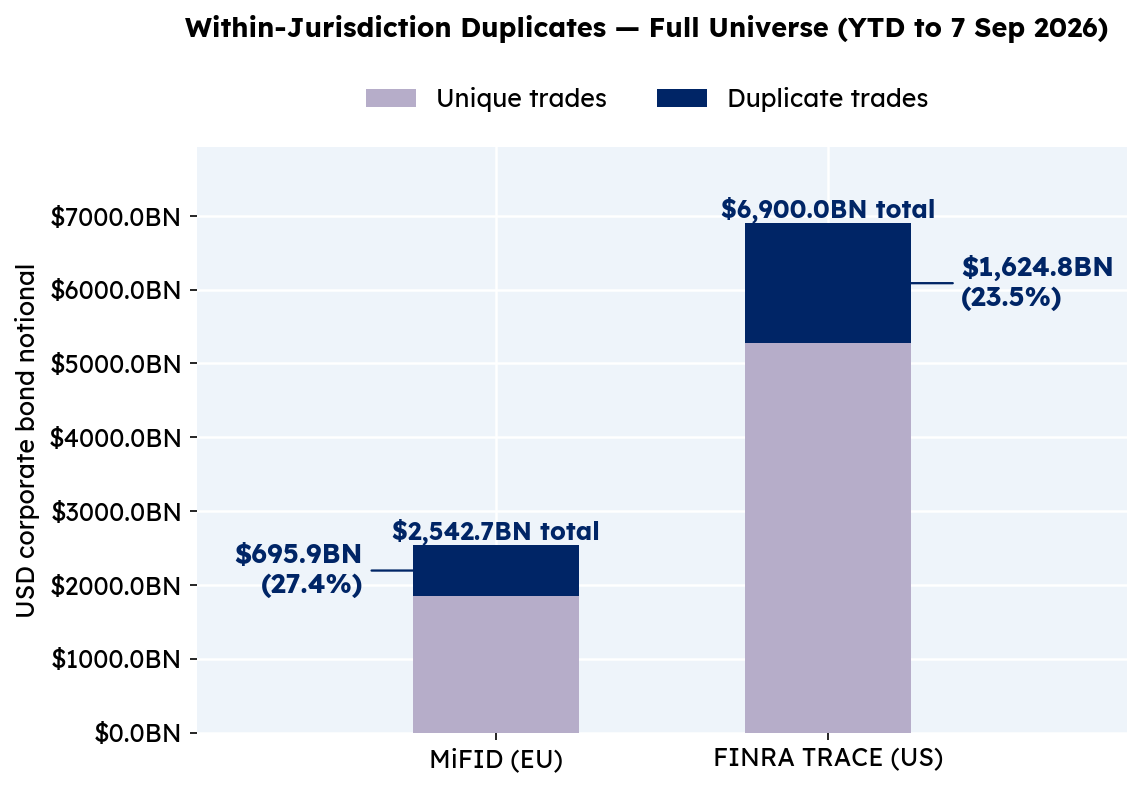
Chart 1 above shows the relative volumes of USD denominated corporate bond activity split between MiFID and TRACE reporting, using a dataset restricted to only those ISINs that appear in both.
Unsurprisingly the FINRA TRACE data accounts for a far larger volume of activity, perhaps more surprising is that the duplication rate is far lower than in MiFID data.
For this section, we take a slightly different approach, looking at all real-time USD corporate bond activity (i.e. some ISINs may exist only in MiFID or in TRACE) to see how reports are broken down throughout the trading day.
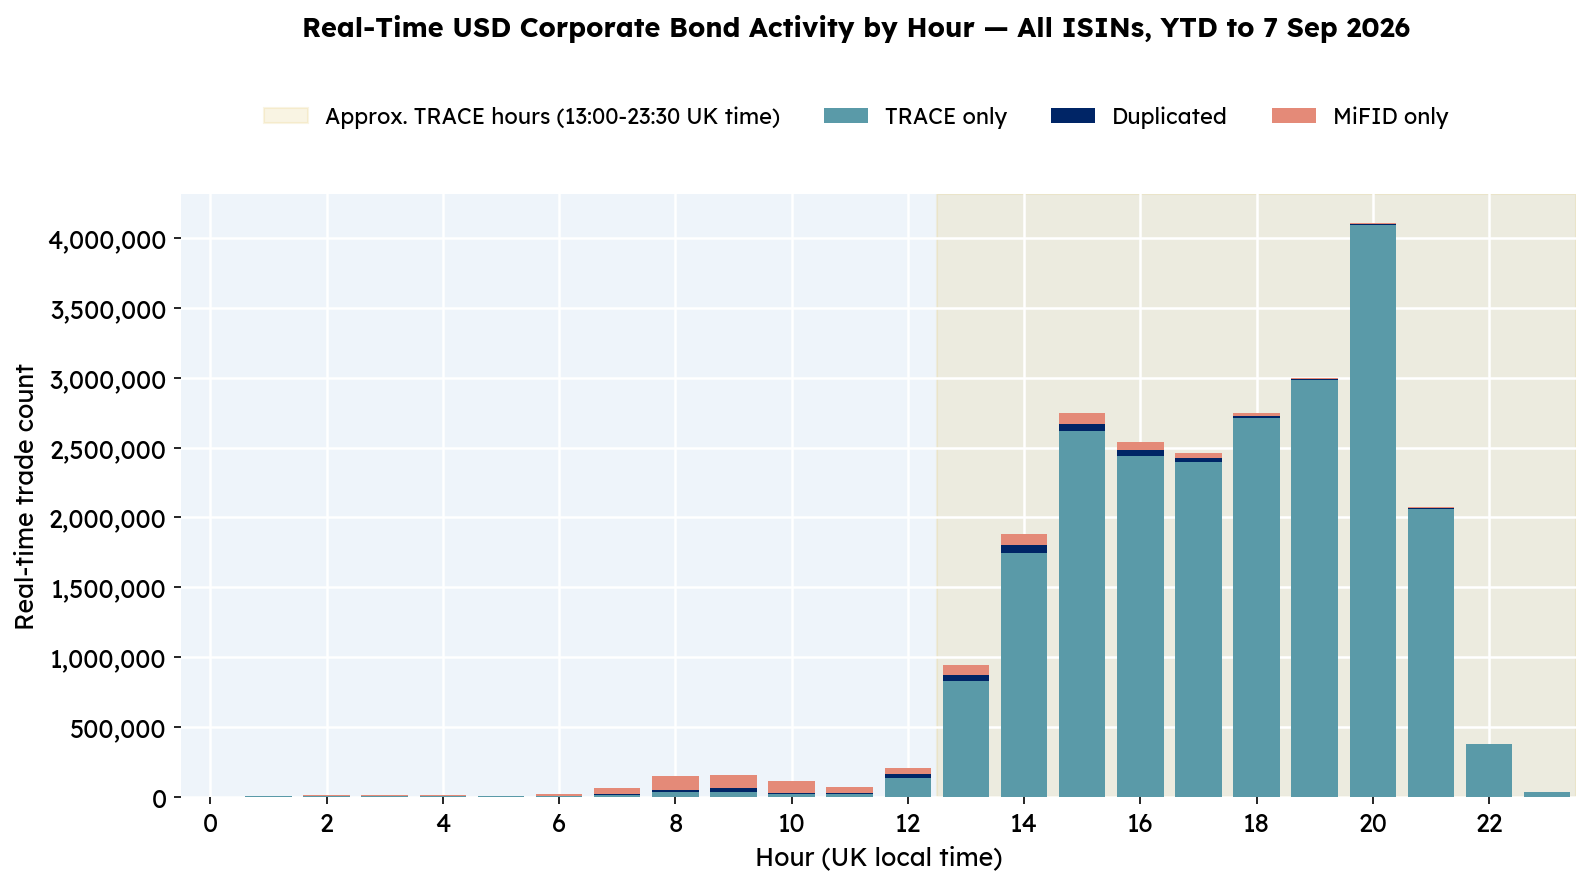
The chart shows an interesting, if unsurprising trend. USD corporate bonds are more active in the European afternoon / evening. This is of course completely in-line with expectations as TRACE is active throughout the East Coast trading day in the US.
We can see that USD activity in MiFID is fairly thin in the early hours of the European morning, but it picks up from around 07:00 UK local time (UTC) onwards.
From 13:00 UTC onwards we see activity (and therefore the number of duplicates) dramatically increasing. As we will see on the next page, the majority of duplicates (as a percentage of total volume) actually occur on the MiFID side.
The USD reporting activity peaks between 20:00 and 21:00 UTC, which is towards the end of the normal market hours in New York. Given bonds trade over the counter (OTC), defined market hours do not exist as such, but as the data shows the bulk of activity occurs when the NYSE is open1.
We now turn our attention to a sub-set of duplicates (again only considering ISINs that appear in both TRACE and MiFID datasets) and we can see the notional amount affected is far greater on the TRACE side, whilst in percentage terms it is far higher on the MiFID side.
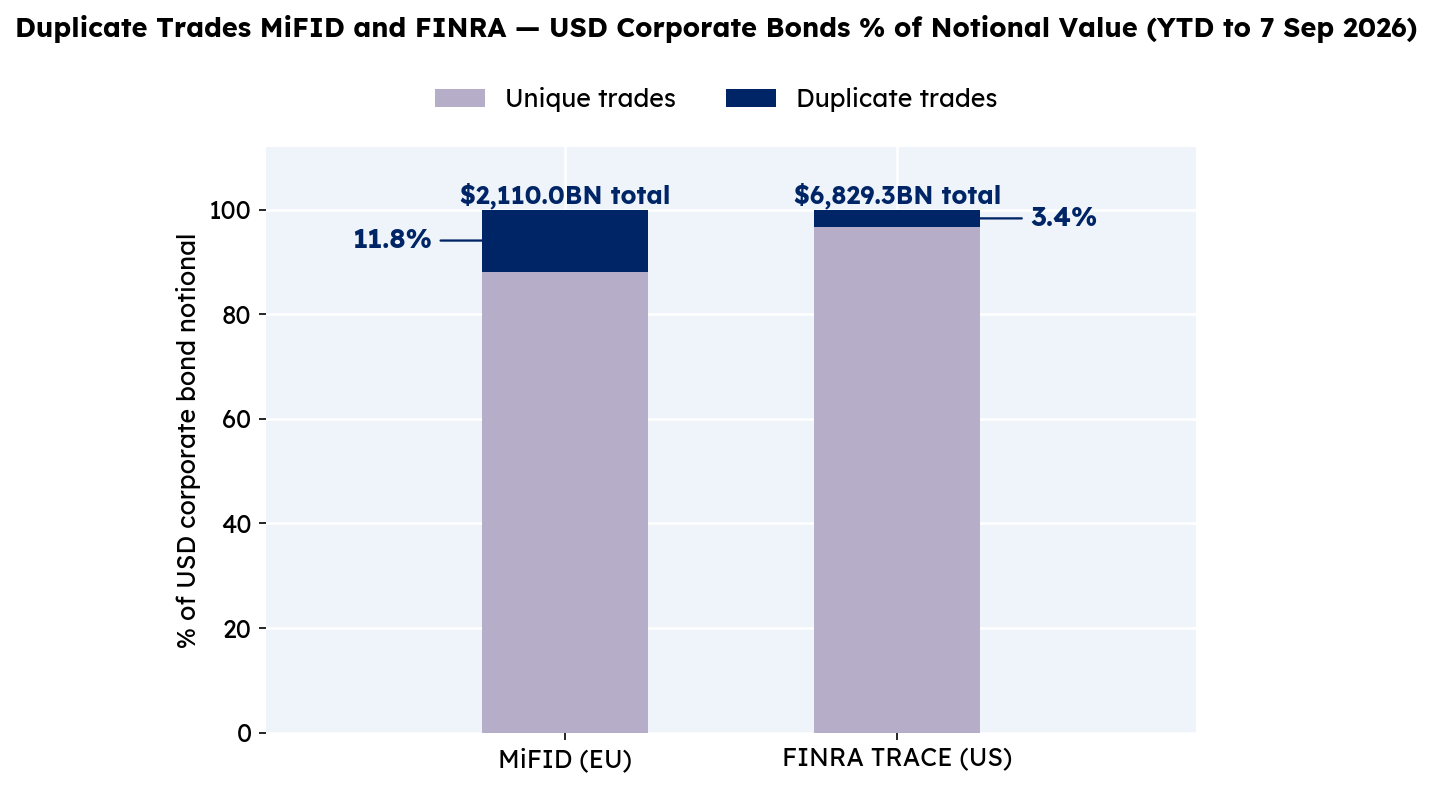
For the avoidance of doubt, we are deeming a report to be a cross jurisdiction duplicate when an identical trade is reported via TRACE and MiFID. For this exercise ‘identical’ is defined as having a matching price and size and timestamp within a second (this is necessary due to the differences in reporting requirements).
Due to the deferral rules in MiFID and the notional cap rules in TRACE it is inevitable that the true number would be different, however this gives us a reasonable approximation.
It is unclear why proportionally more cross jurisdiction duplicates occur within the MiFID data, the trade counts affected are similar (approximately 500k trade reports for both), therefore this could just reflect the lower USD notional volumes reported via MiFID.
As always deferrals and the different dissemination rules, could also go some way to explaining the disparity.
We finish up this week by looking at just the real-time component of these trades (this only affects MiFID data as the subset of TRACE data we are looking at here is reported in real-time anyway).
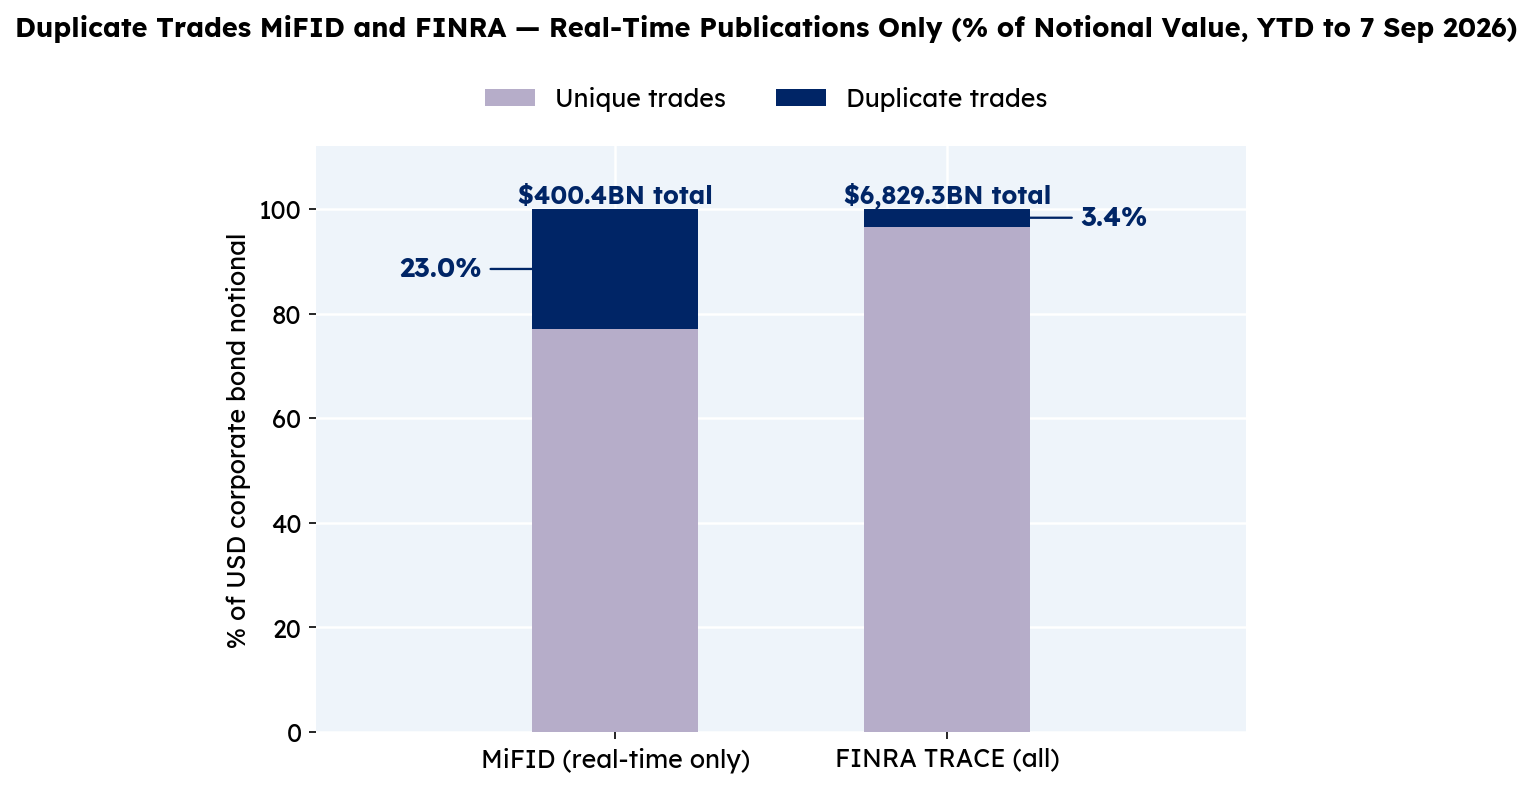
When considering only real-time reporting, the percentage of duplicates more than doubles. In terms of trade count it actually decreases (but proportionally is higher).
This tells us that it is the smaller tickets that are being reported more than once (i.e. via MiFID and TRACE), with the larger deferred tickets seemingly less likely to be duplicated.
Of course, larger tickets that are deferred are not included in this dataset, but for those larger tickets that are reported, they are still harder to match as TRACE trades above certain sizes have notional caps (1 million for High Yield and 5 million for Investment Grade), which impacts analysis.
We cannot determine conclusively why larger tickets are less likely to be duplicated, however it seems likely that as there are fewer and they are more material to the traders, perhaps additional controls are in-place when booking, reducing the error rate.
“The degree of duplication between TRACE and MiFID is higher than might be expected, additionally the majority of USD activity occurs after the UK and European markets close. Therefore in order to create a complete and accurate picture of USD corporate bond trading activity it can not be done by looking at either dataset in isolation.”


Original photograph taken by Richard Hadley
Dan Barnes - Dan is a highly experienced market commentator and founder of multiple media ventures including Trader TV and The Desk.
He is contributing as a guest editor for Propellant Insights ahead of starting a new venture in Q4 this year.
Vidal Mehra - Vidal is Chief Product Officer for Propellant Digital and the lead author for Propellant Insights.
He has been working with financial institutions for over 20 years across multiple disciplines including front office and consulting roles.

Helena Roughton - Helena recently joined the team as a Product Manager, bringing extensive MiFID policy experience having previously worked at AFME.
She also brings product remediation and data analysis experience from the Bank of New Zealand.
%20(11).png)