%20(8).png)
Portfolio and package trading has been a hot topic of conversation over the last few years with a long-term trend showing increasing volume; is this still the case across the board in 2026? We analyse activity and the capacity to see it clearly, given current deferral windows.


Before we begin, we should remind ourselves what we mean by portfolio and package trades, so getting straight into it, starting with the UK’s Financial Conduct Authority (FCA) definitions1.
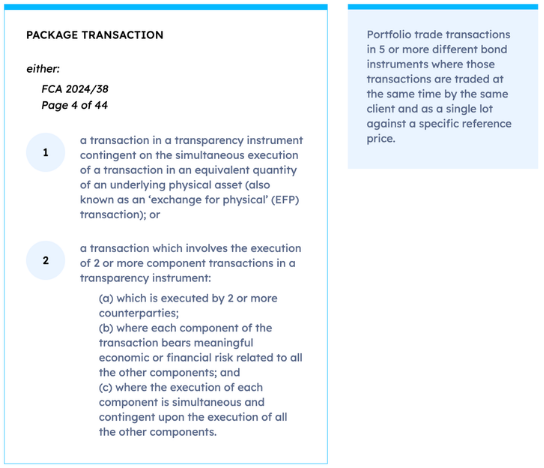
Next we will have a look at the European Securities and Markets Authority (ESMA) definitions of both, for trading in the European Union, before we consider what these mean in practice.
Below are ESMA’s definitions for package and portfolio trades, which are not dissimilar to the FCA’s.
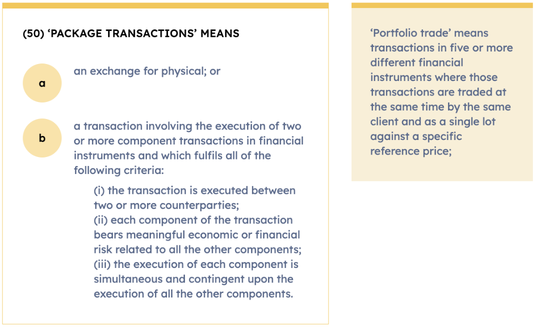
Comparing ESMA's definitions to the FCA's definitions it is evident there are only some subtle differences. In practice this means market participants tend to treat both rule sets as if they are the same.
For this reason there is a degree of harmonisation of treatment across the EU and UK.
One interesting quirk is that for a package transaction (considering only bonds), both ESMA2 and the FCA¹ permit the entire package to be deferred based on the instrument within the package with the longest deferral. This contrasts to the portfolio trade treatment, which states that each line item should be booked (and deferred or not) based on the individual trade characteristics.
Anecdotally, market participants often talk about the increase in portfolio trading activity as a catch-all for both portfolio and package transactions. However, when we separate the two in the data, we can see different patterns of activity.
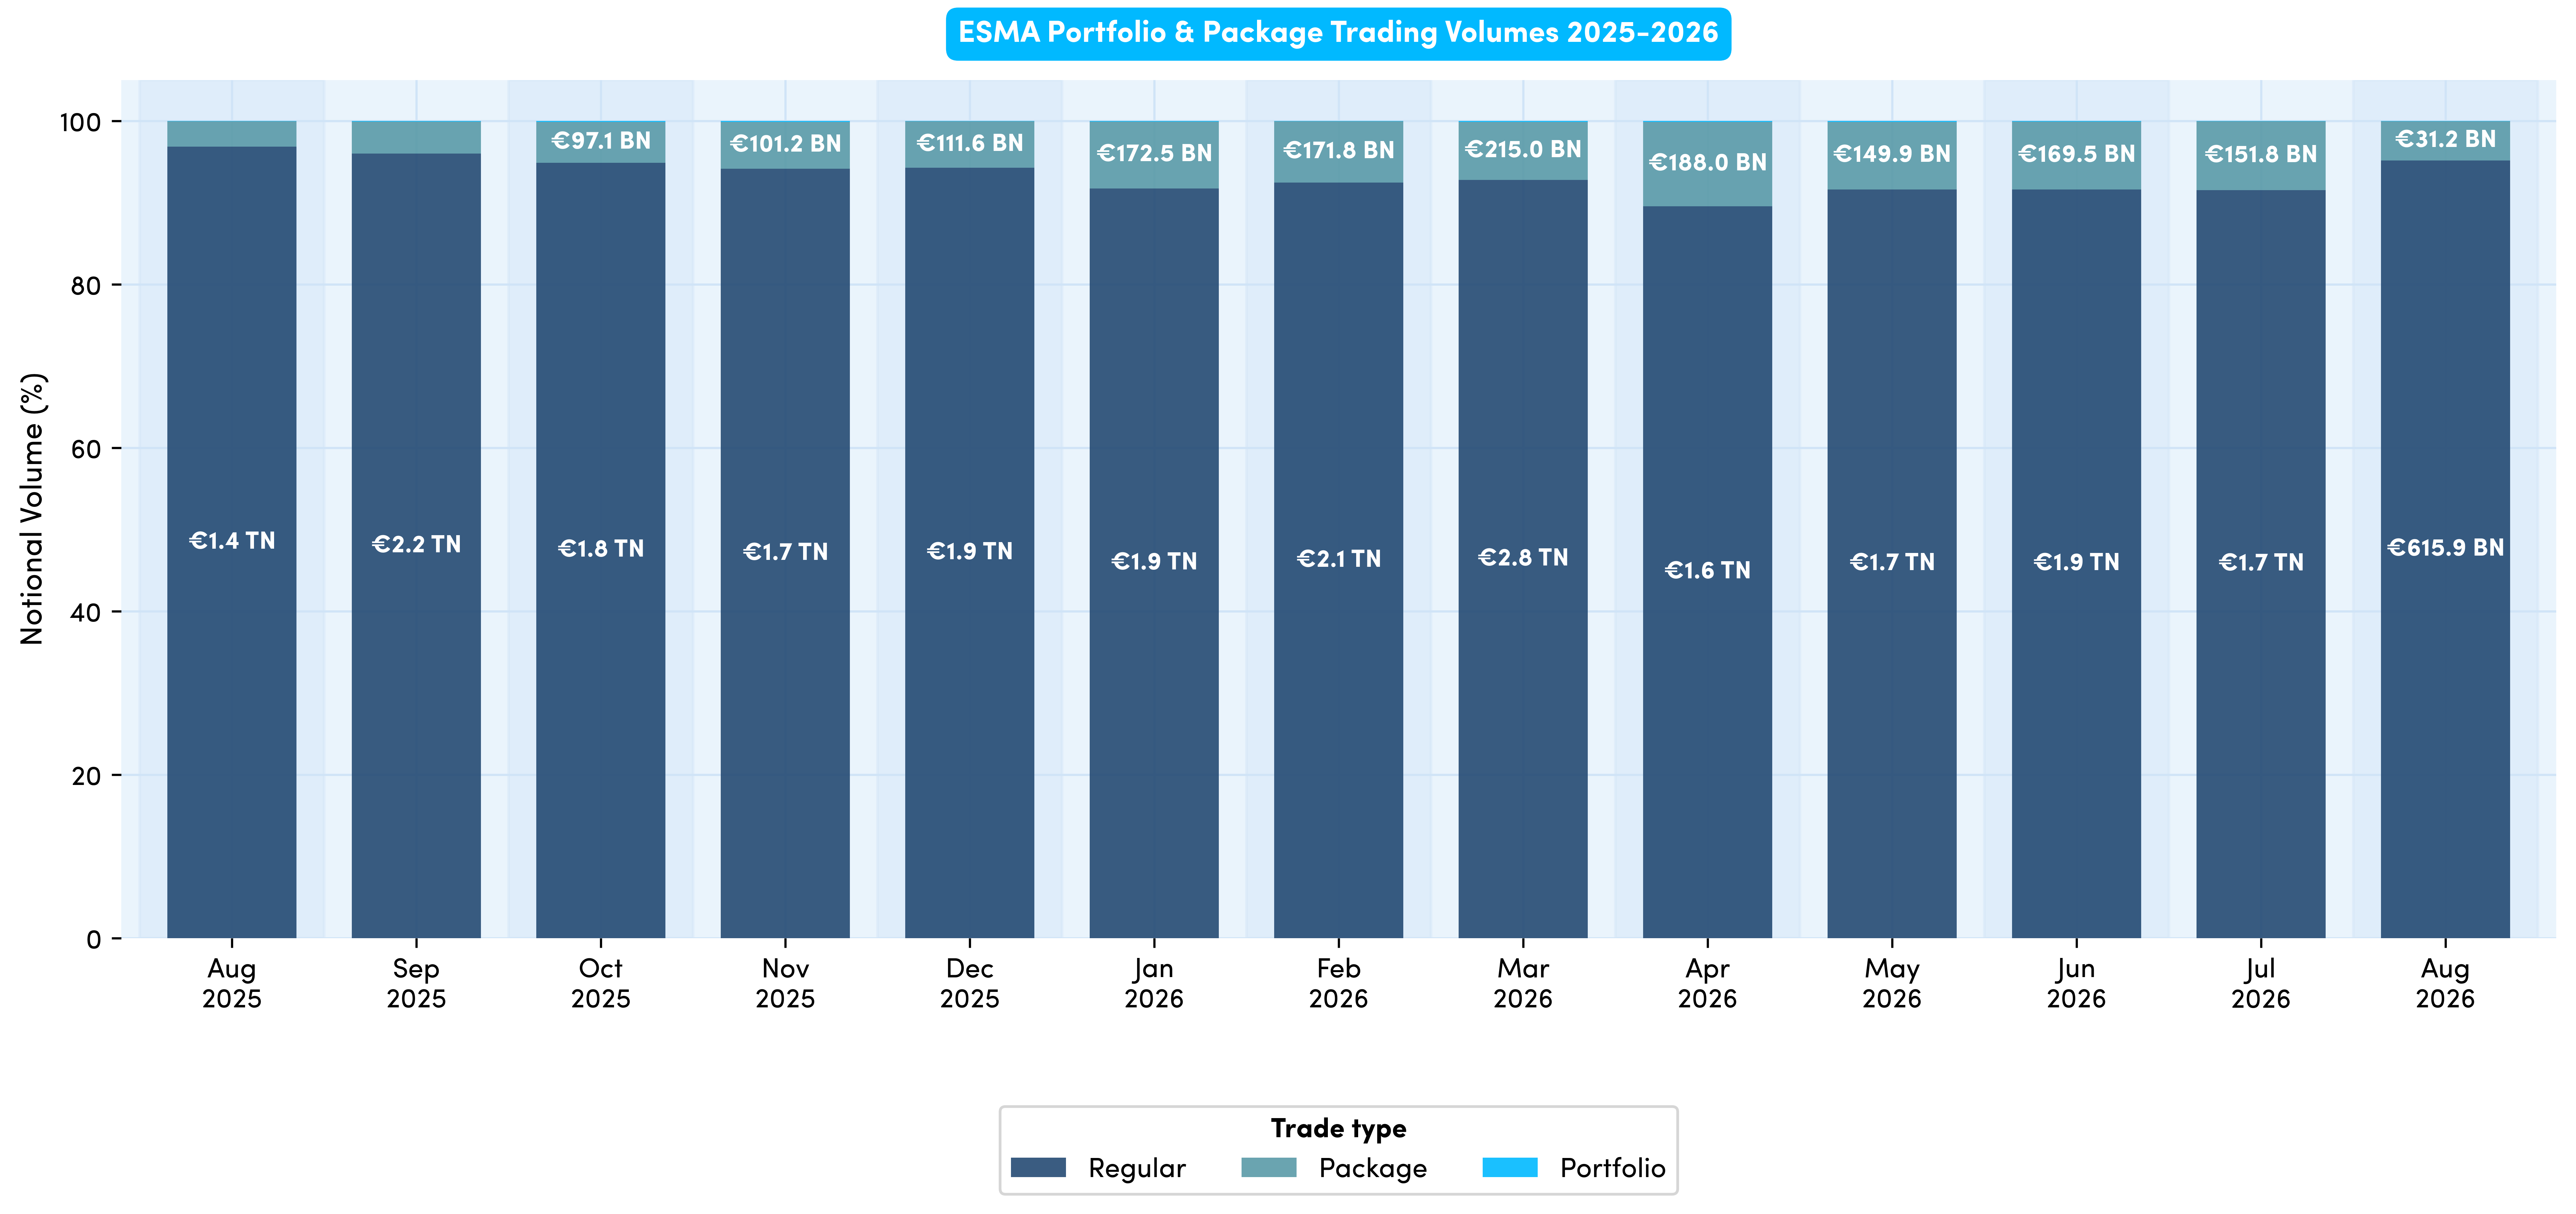
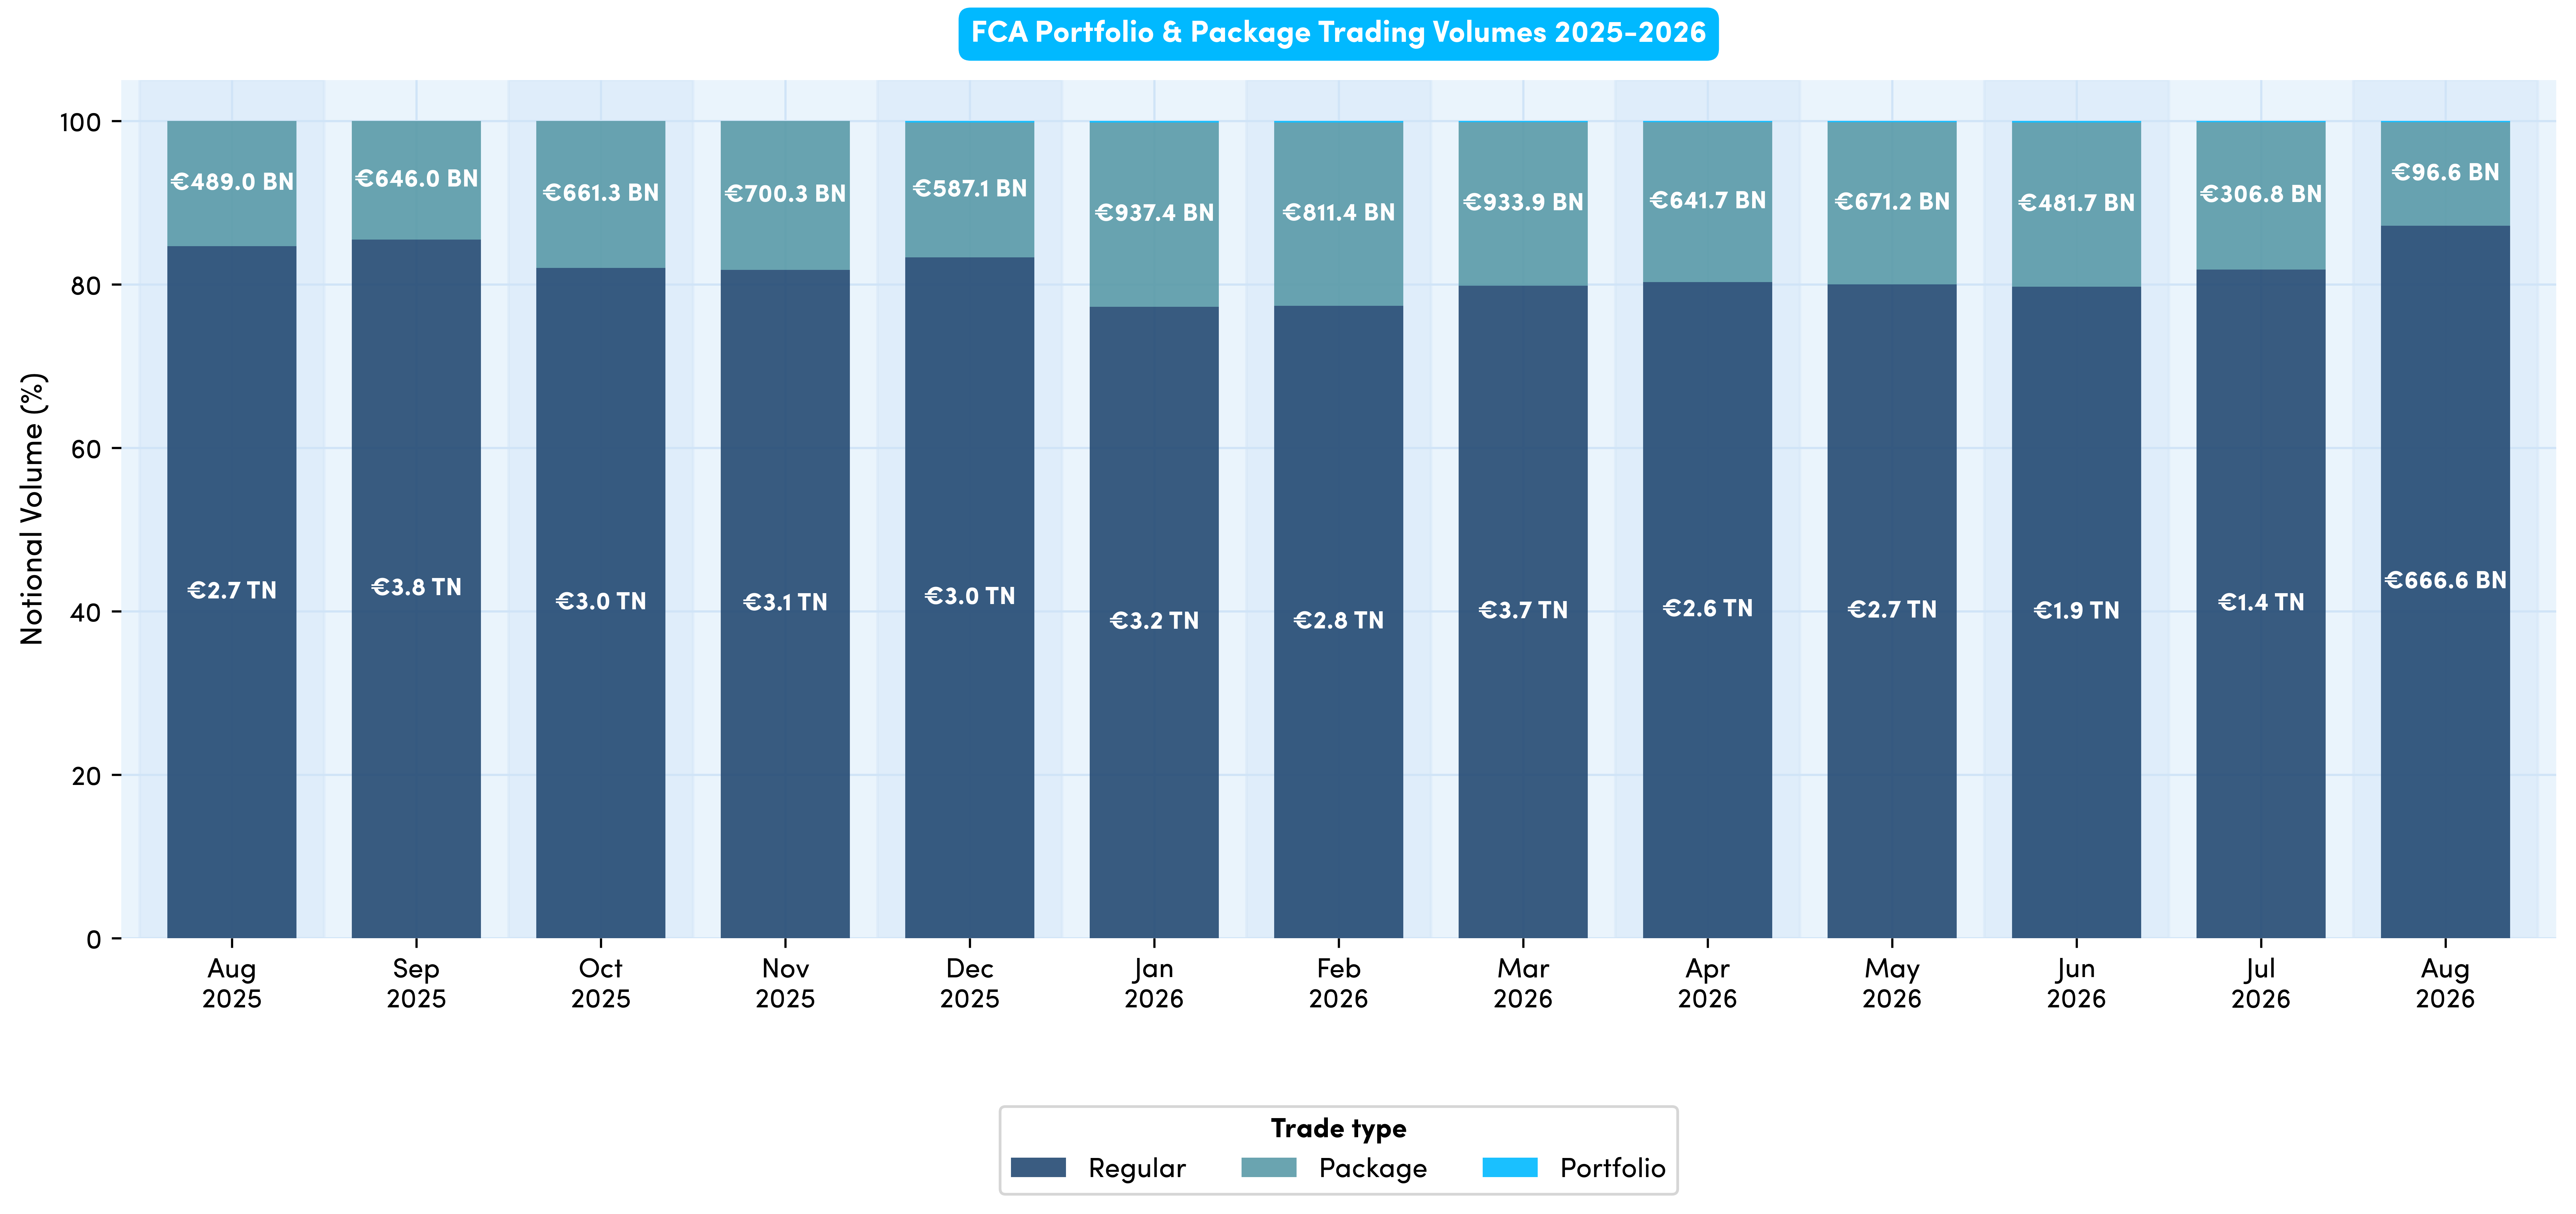
ESMA reported transactions are in Chart 1 above, with FCA reported transactions in Chart 2 below, however both interestingly show decreasing notional traded in recent months.
We can see from Chart 1 that the ESMA package trading activity (as a percentage of overall activity) peaked in April 2026 and has not trended upwards since. ESMA trades can only be deferred for a maximum of four weeks, so this suggests the reduced activity is genuine.
FCA activity peaked earlier in the year, around February, with package activity seemingly flatlining in recent months (in percentage terms). Portfolio activity (for both ESMA and the FCA) was so minimal (in percentage terms), it barely shows up on charts 1 and 2, therefore we will drill down into that in the next section.
Importantly we need to consider that the FCA has a much longer maximum deferral of three months, but also the FCA has Category 2 Instruments, for which the venue determines the deferral period, which we will look at now.

When the new FCA transparency regime came into play in December 2025, the notion of Category 2 was introduced for the first time. As we can see above, for package transactions including Category 2 instruments, the number appears consistently low (albeit even lower since March), and for portfolio trades has been trending lower.
As Category 2 instruments have the applicable deferral determined by the venue, in the most extreme case a trade could be deferred for around six months, which could partially explain the drop off towards the present day, as these trades may not yet show.
We can break down the potential impact of Category 2 further, starting with portfolio trades.
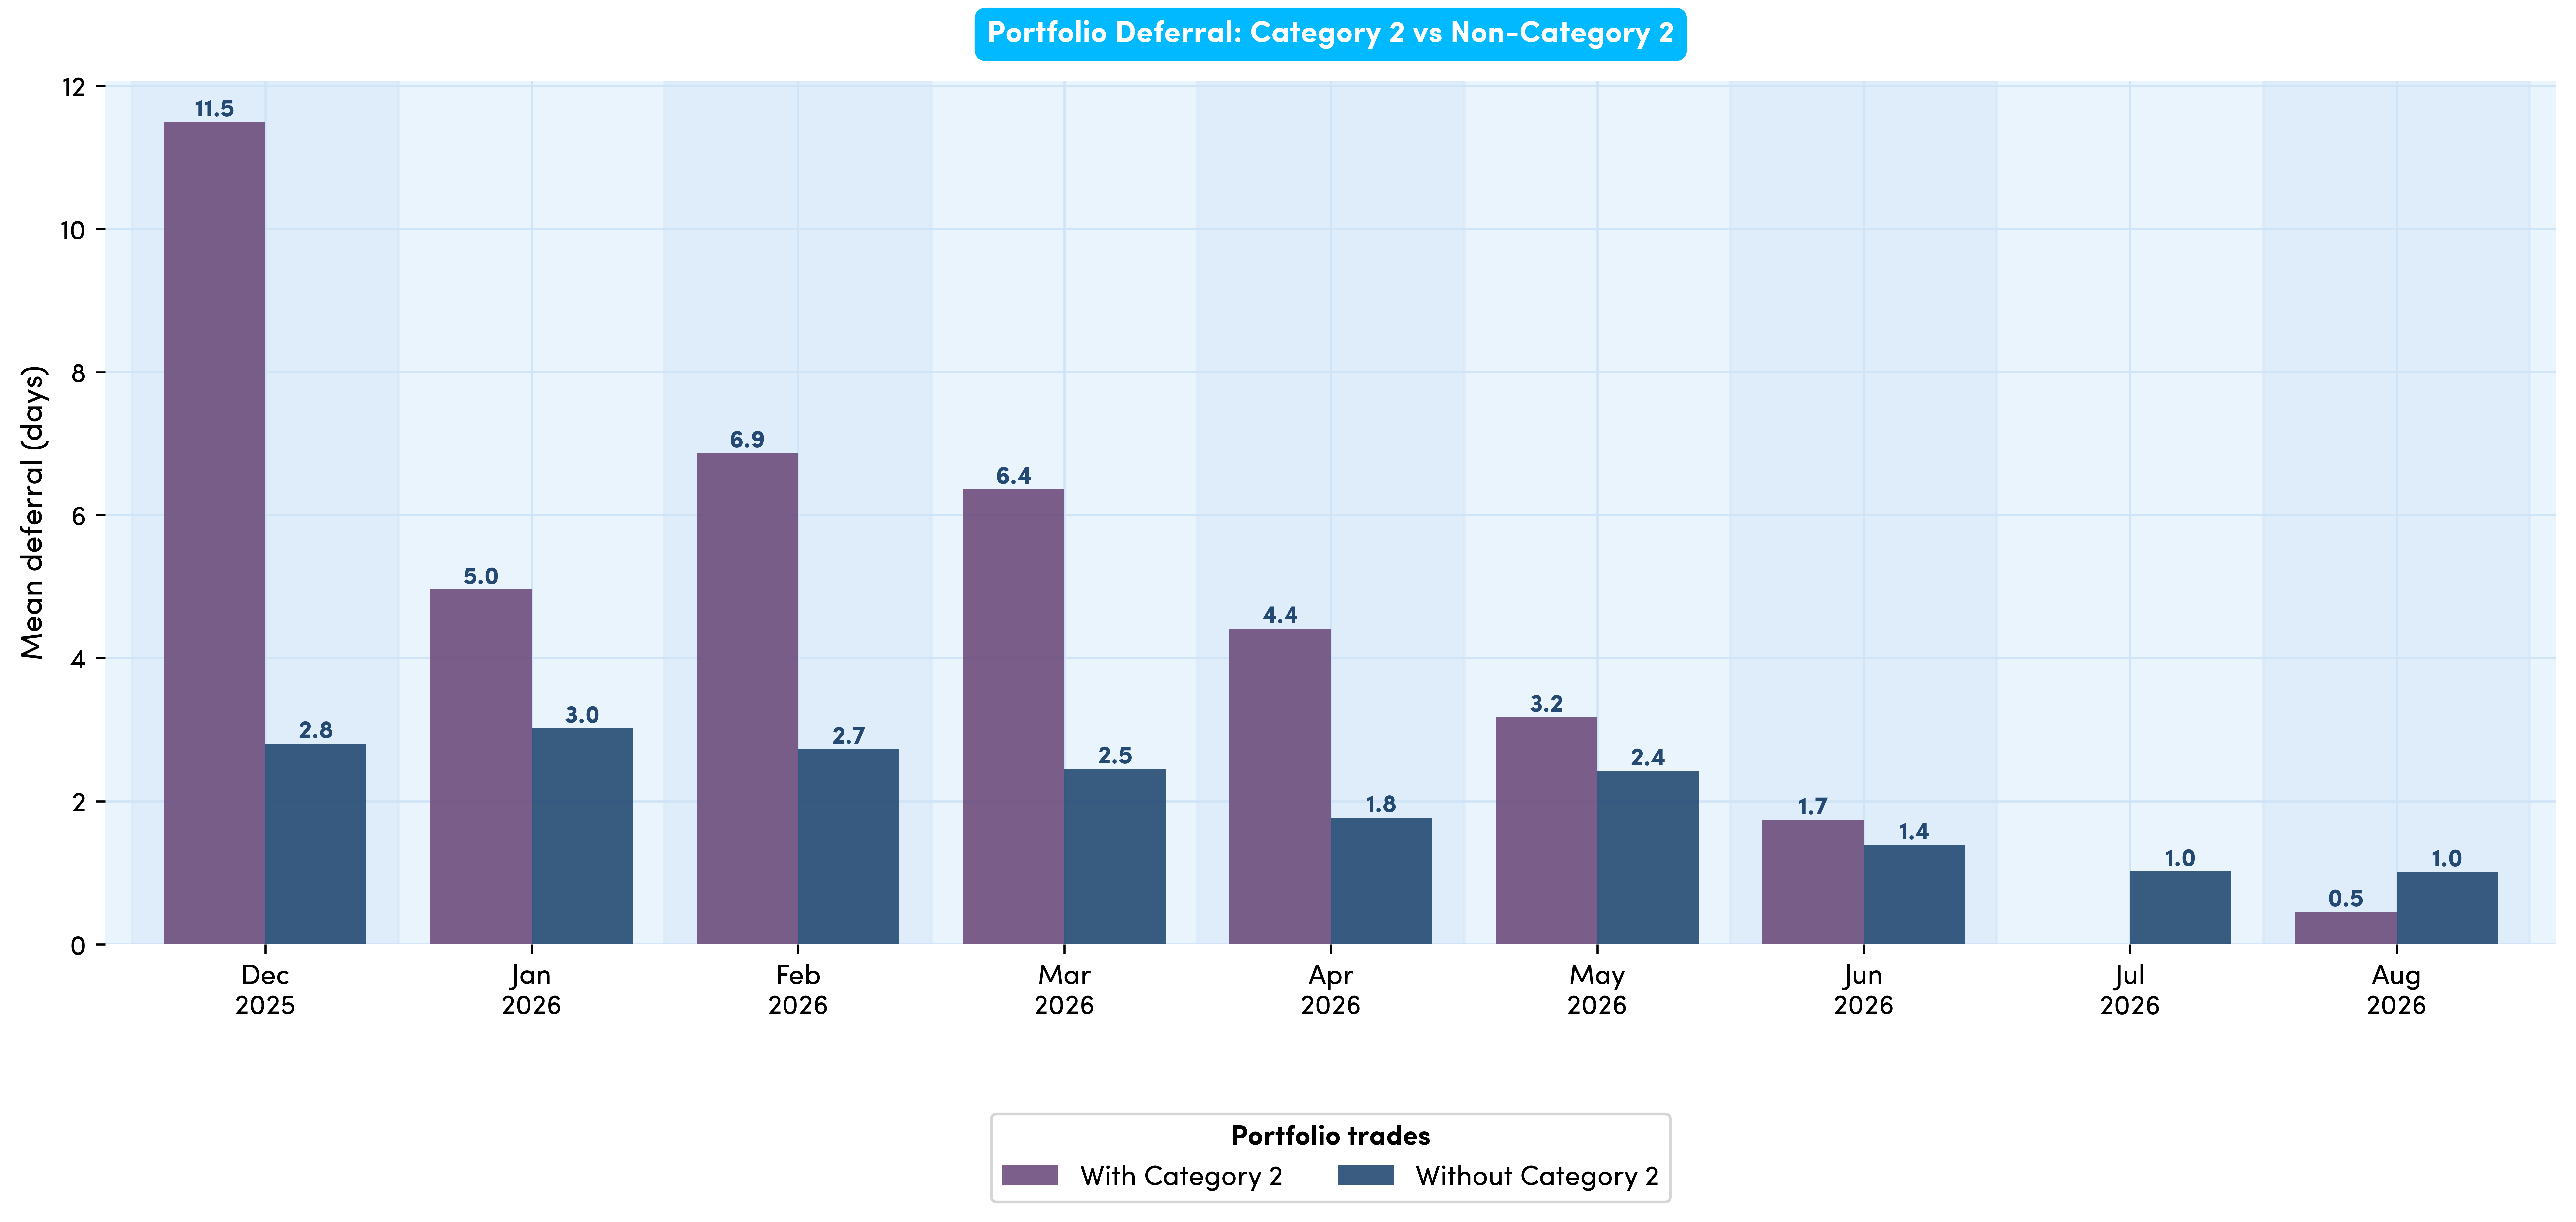
Chart 4 above shows us the mean maximum deferral for a portfolio trade line item (i.e. we consider the maximum deferral for any line item in a portfolio trade and then plot the average of these above).
We can see that for transactions without Category 2 instruments it has trended a bit lower over time, but this is not as pronounced as the reduction for those transactions which do involve Category 2 instruments.
Deferrals are likely to play a part here and whilst these are not exclusive to Category 2, these instruments are often affected more greatly, meaning the deferrals could be longer.
It is also important to note, that for portfolio trades (unlike package trades), each line item is deferred based on its own characteristics, meaning some line items will be reported in real-time, whilst in the most extreme case some legs may not appear for almost six months.
Next we apply the same logic to package transactions, as show in Chart 5 below.
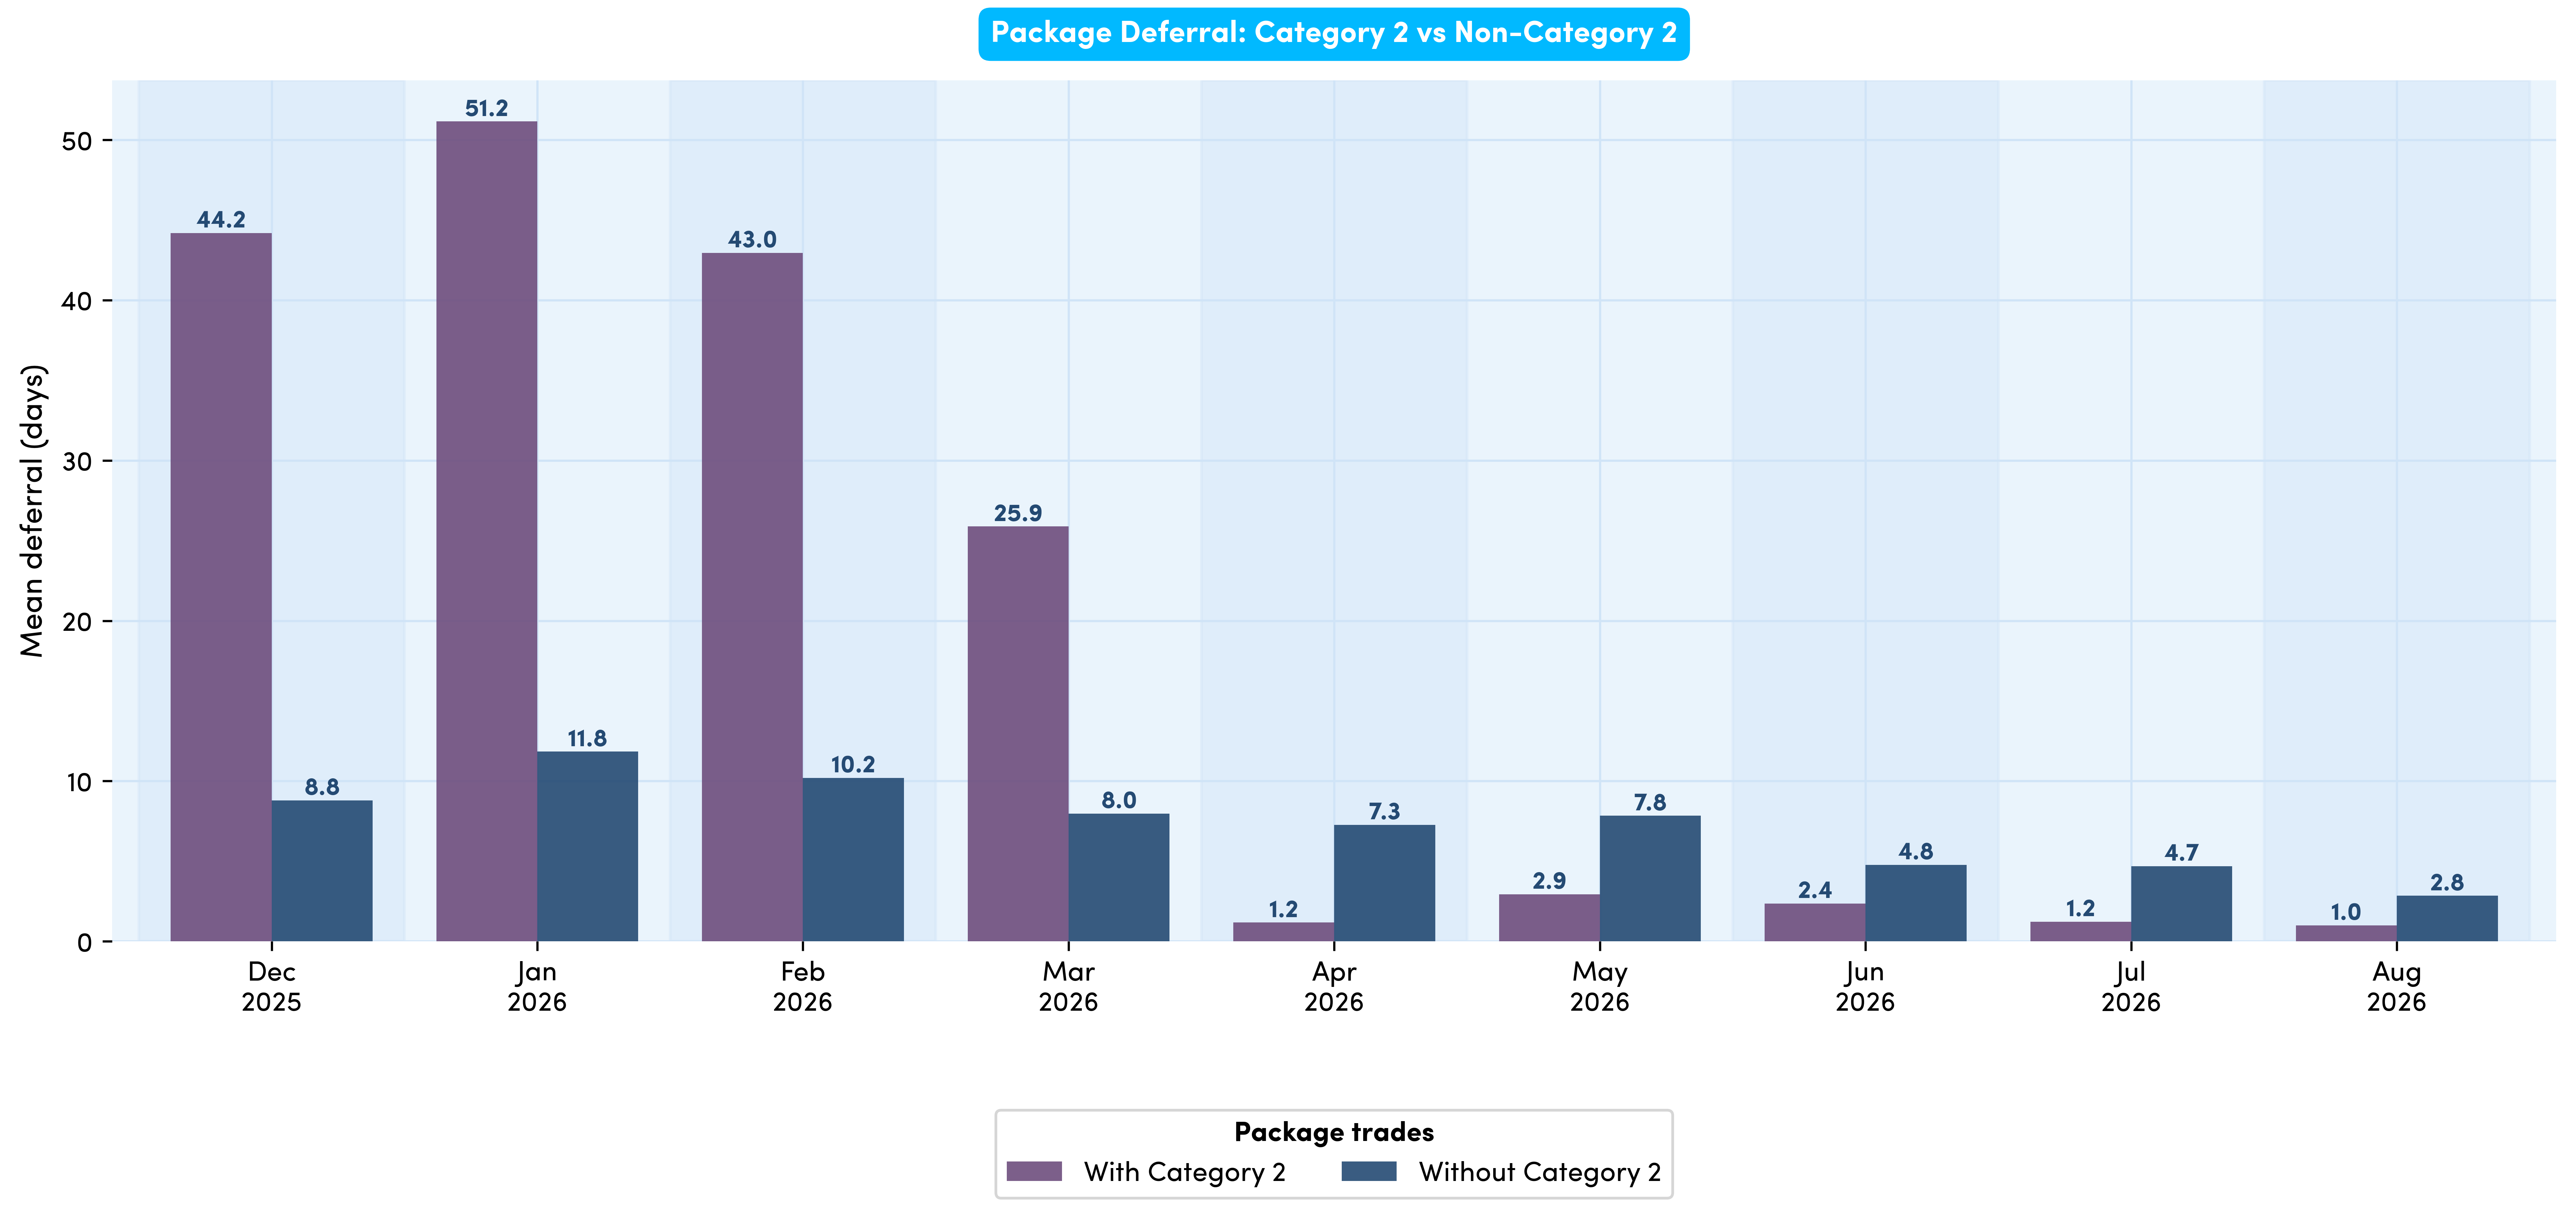
The sharp drop-off in deferral times for packages occurs after March, which is interesting, given the maximum deferral for bonds. At face value, Chart 5 suggests that deferral times may appear to be dropping on average, however in reality it appears highly likely this is simply due to deferred transactions not yet showing.
“Whilst the overall volume of package transactions in the ESMA region has decreased recently, proportionally it remains broadly flat over the last few months. For FCA reported transactions, however, both volumes and the percentage proportion have reduced significantly which is an interesting trend. The deferral data suggests that longer package deferrals, including those applicable to swaps or perhaps Category 2 instruments could be a factor here. We will take another look later in the year, once we have been through more deferral cycles.”


Original photograph taken by Richard Hadley
Dan Barnes - Dan is a highly experienced market commentator and founder of multiple media ventures including Trader TV and The Desk.
He is contributing as a guest editor for Propellant Insights ahead of starting a new venture in Q4 this year.
Vidal Mehra - Vidal is Chief Product Officer for Propellant Digital and the lead author for Propellant Insights.
He has been working with financial institutions for over 20 years across multiple disciplines including front office and consulting roles.

Helena Roughton - Helena recently joined the team as a Product Manager, bringing extensive MiFID policy experience having previously worked at AFME.
She also brings product remediation and data analysis experience from the Bank of New Zealand.

%20(11).png)