

Artificial Intelligence (AI) technology has the potential to change many aspects of the way we work. For many market participants there is a quest to use AI as a predictive tool, but how good can predictions really be, with the right data?


Data Science and the use of AI go hand-in-hand in the modern era. A data scientist is typically tasked with using data to obtain insights, and along with quants, are now increasingly common on trading desks, a trend observed as far back as 20171).
“Data Science is a field that combines statistics, machine learning and data visualization to extract meaningful insights from vast amounts of raw data and make informed decisions, helping businesses and industries to optimize their operations and predict future trends.”2
Data Scientists are increasingly important within trading businesses, partly because of the recent focus around AI tools, but largely because of the increasing reliance on data for decision making, as data becomes more reliable and accessible.
Whilst not always the case, when we talk about AI in a data science context we are often referring specifically to the discipline of ‘machine learning’.
“Machine learning is a subset of artificial intelligence that automatically enables a machine or system to learn and improve from experience. Instead of explicit programming, machine learning uses algorithms to analyze large amounts of data, learn from the insights, and then make informed decisions.
Machine learning algorithms improve performance over time as they are trained—exposed to more data. Machine learning models are the output, or what the program learns from running an algorithm on training data. The more data used, the better the model will get.”3
To explain how we can build a predictive model for capital markets, it is first necessary to understand the key steps that a data scientist might take. Chart 1 below shows the Cross-Industry Standard Process for Data Mining (CRISP-DM)4.
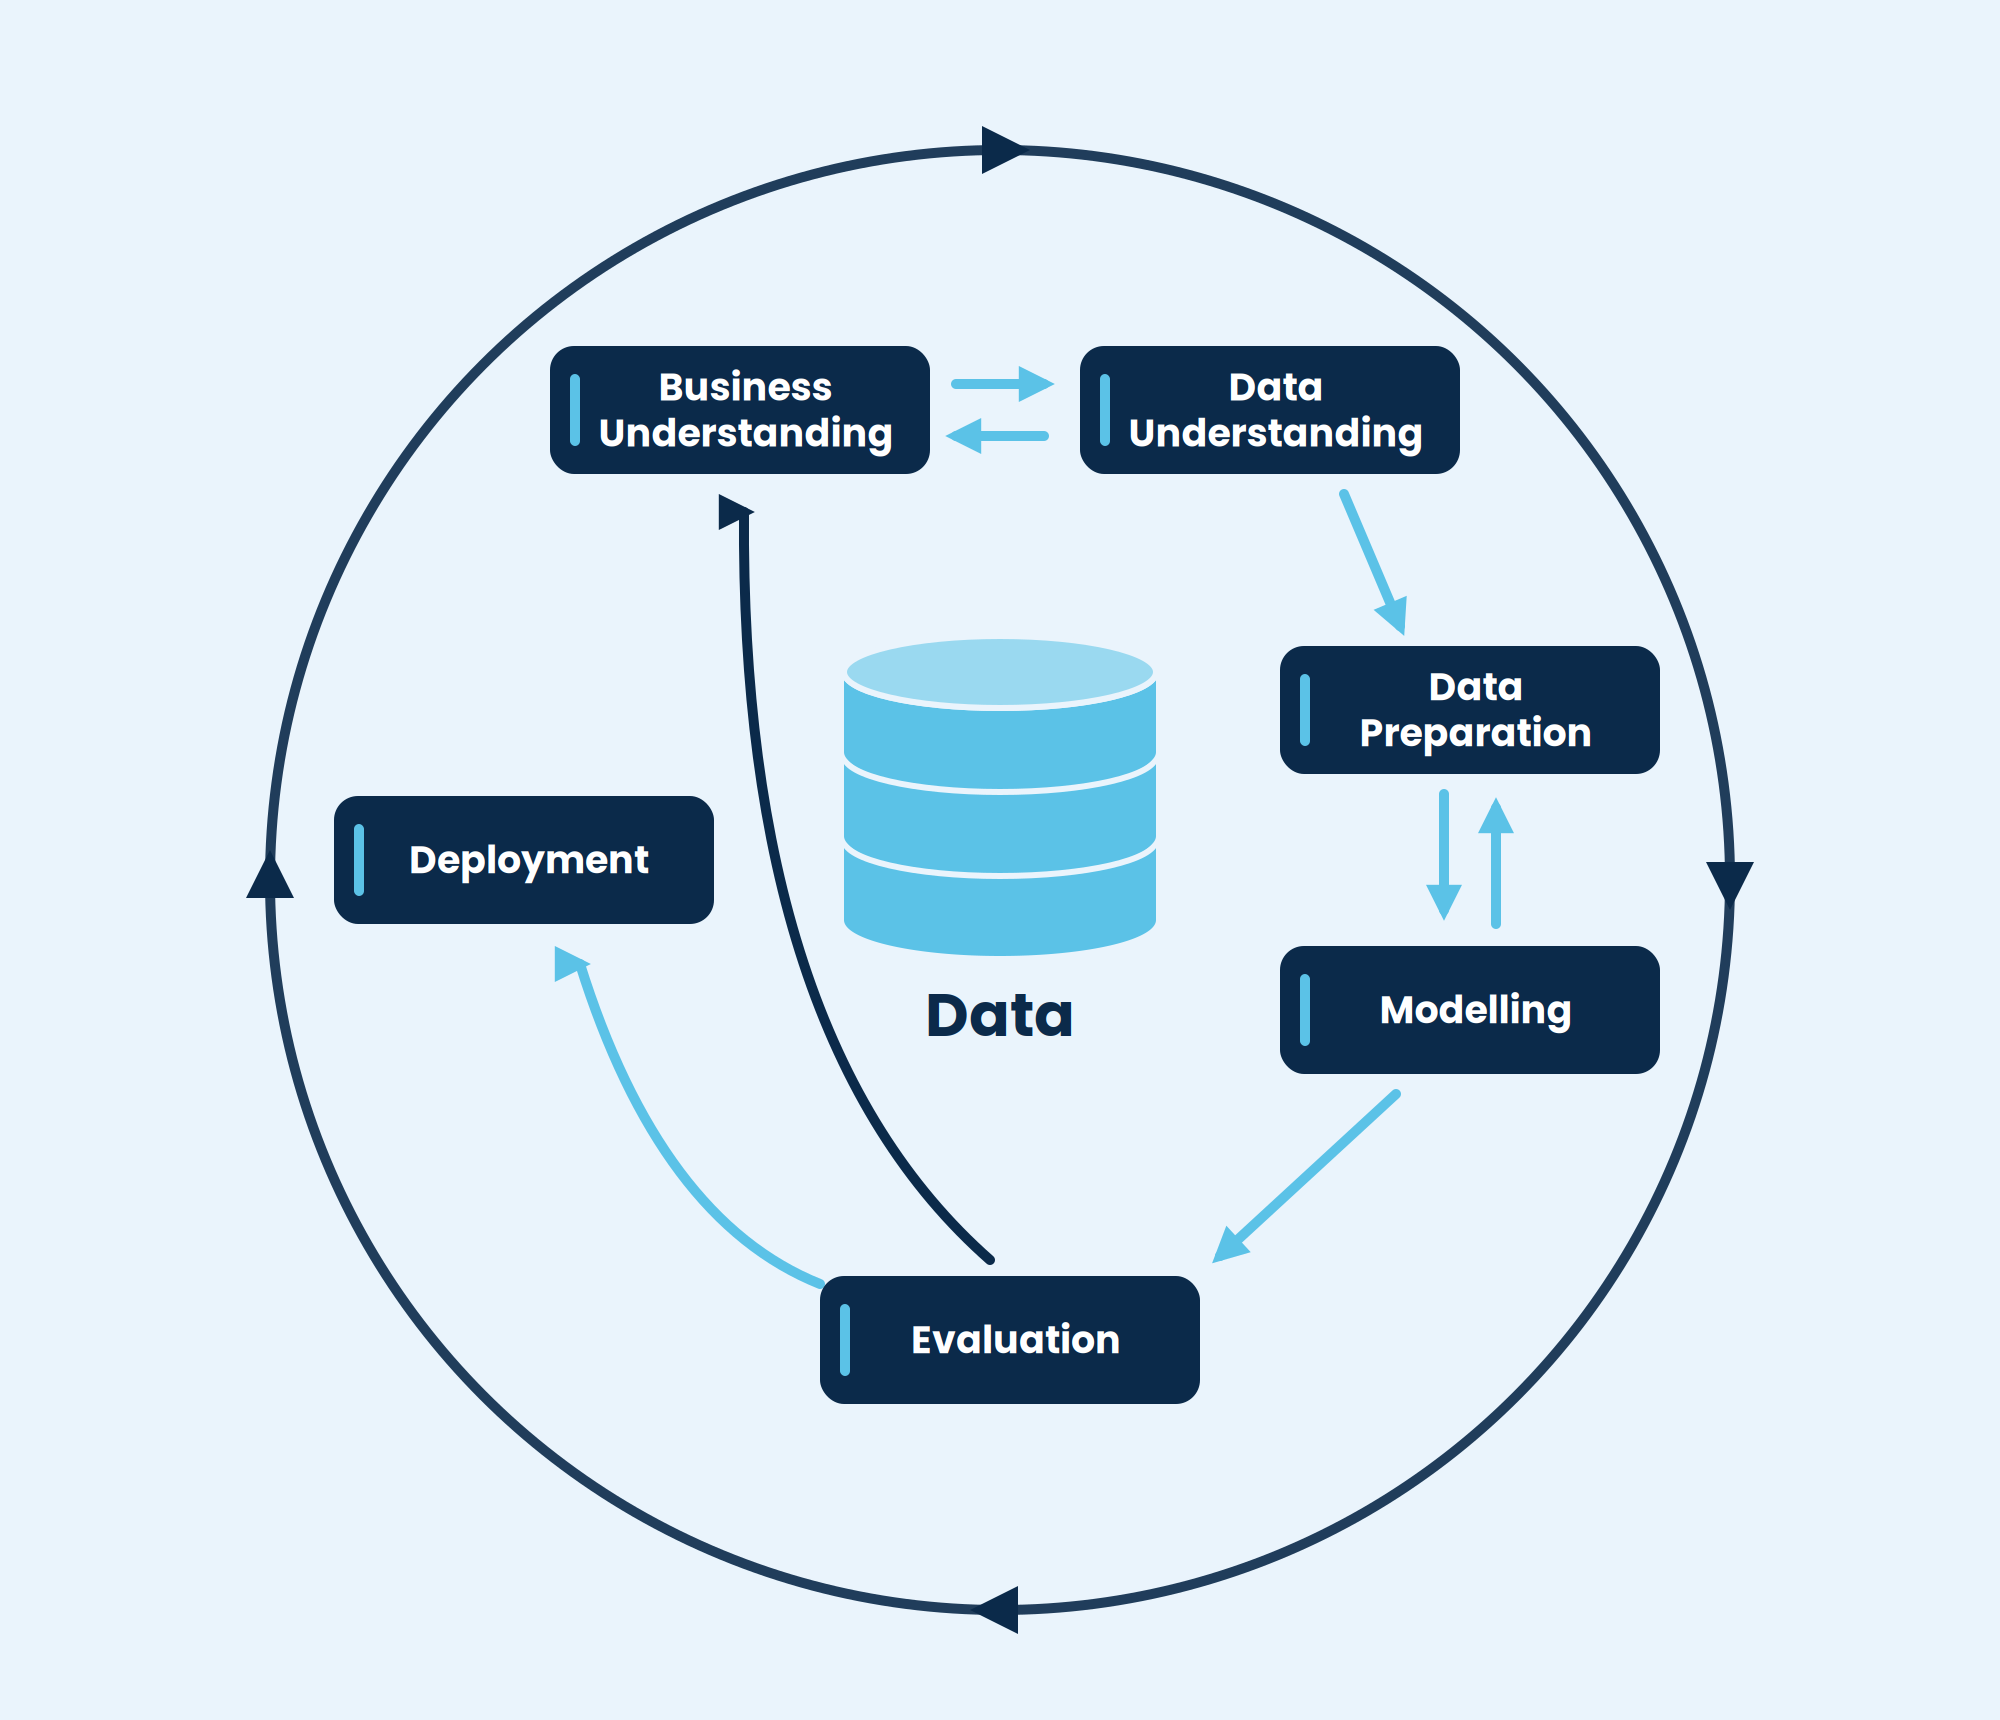
In simplistic terms the above chart is showing us that firstly any modelling process is naturally iterative, i.e. that whilst an initial understanding of the data is assumed, this understanding can be enhanced post testing.
Whilst we will not focus on deployment in this article we will talk about preparation, modelling and how to evaluate the results of a predictive model.
To apply machine learning to the fixed income space, a data scientist must engage in several processes beforehand with the data. By necessity they must understand the data and how different data points are used, such as how bonds are typically priced.
To give an example, in a series of prices from reported trades: 101; 99.95; 4.85; and 99.90, one of these should stick out as not just an outlier, but likely a yield. A data scientist who understands this should able to convert the yield into a price, and therefore avoid having to remove this trade report from the data. Alternatively they may choose to remove all rows reported as yields. The important thing here is consistency.
The above is an example of data preparation. Other examples of necessary steps include de-duplication and the removal of erroneous data or extreme outliers. Whilst the latter is not always desirable, for machine learning based predictive efforts this is a common step.
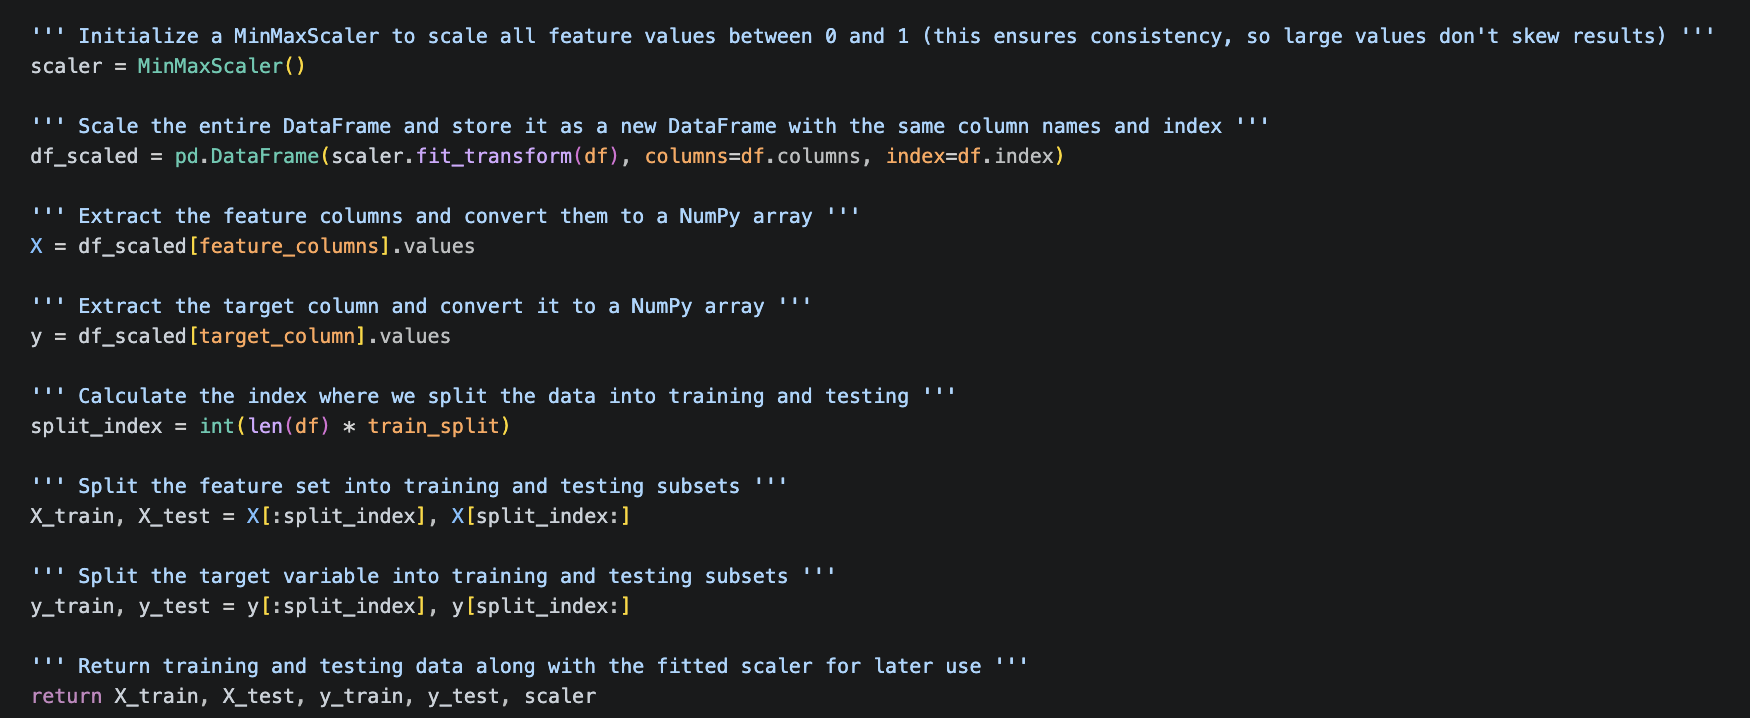
Additionally, before running a full test, depending on the type of data it may be appropriate to ‘scale’ the data which involves re-basing all numeric values on a scale between ‘0’ and ‘1’.
A typical script or notebook run by a data scientist, may look something like the one below in Figure 2.
Features are the inputs the model considers when making its predictions. They can be fairly simple, such as the bond coupon or maturity date, or more complex, such as time to maturity (as opposed to ‘maturity date’). Feature engineering is said to be the hardest and/or most important part of building any predictive model5, but what actually is it?
“Feature engineering is the process of transforming raw data into relevant features for use by machine learning models. It involves selecting and creating input variables (features) that help ML algorithms learn patterns more effectively and make accurate predictions.”6
Features can be vastly more complex than those above and may be the most important aspect of any proprietary model.
One more consideration for data scientists is the concept of ‘out of sample’ testing.
In Figure 2 there are variables shown such as X_test or y_train in the script, which are the various components to be ingested by the model. Whilst terminology is not always consistent, it would be quite common to see the following:
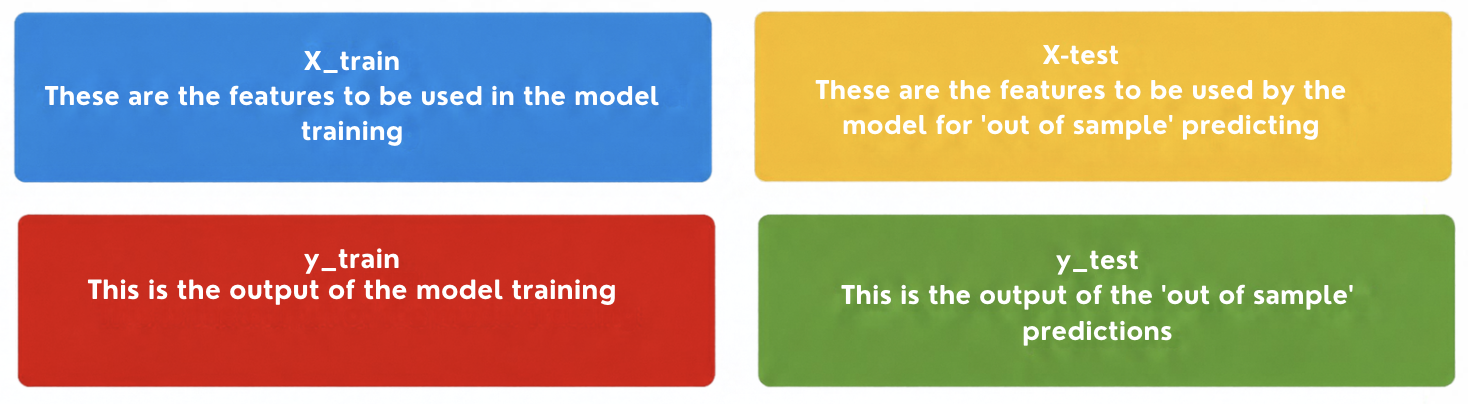
he reason we have separate training and test data sets is because it is important to prove the model works on 'out of sample' data it has not yet seen. This avoids something called overfitting7 (where a model appears to be highly accurate because the variables are optimal for a specific scenario, but may be ineffective for new scenarios).
Additionally in reality it would be fairly common to have the same input features for both training and test datasets (but the outputs would of course typically differ).
Once the test and training data has been prepared, we can then use a machine learning library (typically Python based) to process the data and output some results.
The quality of the features will have a large impact on the predictions.
For our model, we selected a UK gilt at random and trained the model on data from March - July 2026, then predicted prices for July - August 2026.
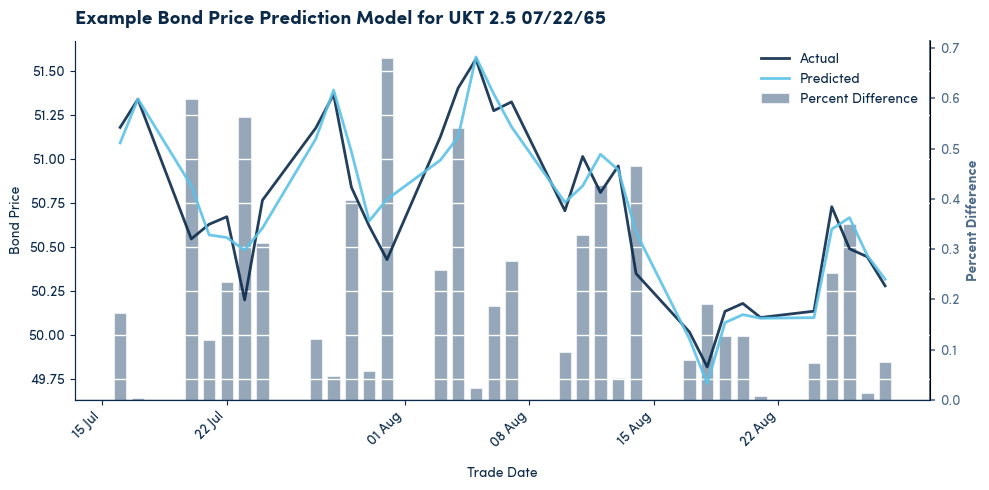
It is common to use mean absolute error (MAE) or mean absolute deviation (MAD) to measure the accuracy of predicted values. In Chart 1 above, for simplicity, we show the percentage difference between the actual and predicted value along with the actual and predicted prices.
The predicted values (shown by the light blue line) are generally very close to the actual values (within 0.7% throughout the period), however as any bond trader knows, being 0.7% off is material in a real world scenario.
“Our example highlights that MiFID data can be used for training a machine learning algorithm with relative ease. The challenge is around fine-tuning the model (which includes feature engineering) to predict with an acceptable level of precision in real-world fast moving markets.”

1https://www.thetradenews.com/bond-trading-desks-seek-data-scientists-to-work-alongside-traders/
2https://www.geeksforgeeks.org/data-science/data-science-for-beginners/
3https://cloud.google.com/learn/artificial-intelligence-vs-machine-learning
4https://www.datascience-pm.com/data-science-workflow/
5https://homes.cs.washington.edu/-pedrod/papers/cacm12.pdf
6https://www,databricks.com/blog/what-is-Feature-engineering
7https://www.ibm.com/think/topics/overfitting

Original photograph taken by Richard Hadley
Dan Barnes - Dan is a highly experienced market commentator and founder of multiple media ventures including Trader TV and The Desk.
He is contributing as a guest editor for Propellant Insights ahead of starting a new venture in Q4 this year.
Vidal Mehra - Vidal is Chief Product Officer for Propellant Digital and the lead author for Propellant Insights.
He has been working with financial institutions for over 20 years across multiple disciplines including front office and consulting roles.

Helena Roughton - Helena recently joined the team as a Product Manager, bringing extensive MiFID policy experience having previously worked at AFME.
She also brings product remediation and data analysis experience from the Bank of New Zealand.
%20(11).png)

%20(10).png)