
Volatility has increased across many bond and equity markets due to the rapidly changing geo-political landscape in 2026, and the outsized effect of AI hyperscalers’ funding programmes. South Korea in particular has experienced some unusually large movements in its equity markets, so this week we contrast this with bond markets via MiFID data and see what insights we can draw out.


South Korea (also known as the Republic of Korea) has been in the news a great deal in recent times, with headlines often referring to equity market volatility1 and ETF flows2.
Whilst 2026 has resulted in large, sudden movements across major global indices3 South Korea’s KOSPI (Korea Composite Stock Price Index) has been particularly noticeable with nine circuit breaks triggered so far (compared to 0 in 2025 and 1 in 2024)4.
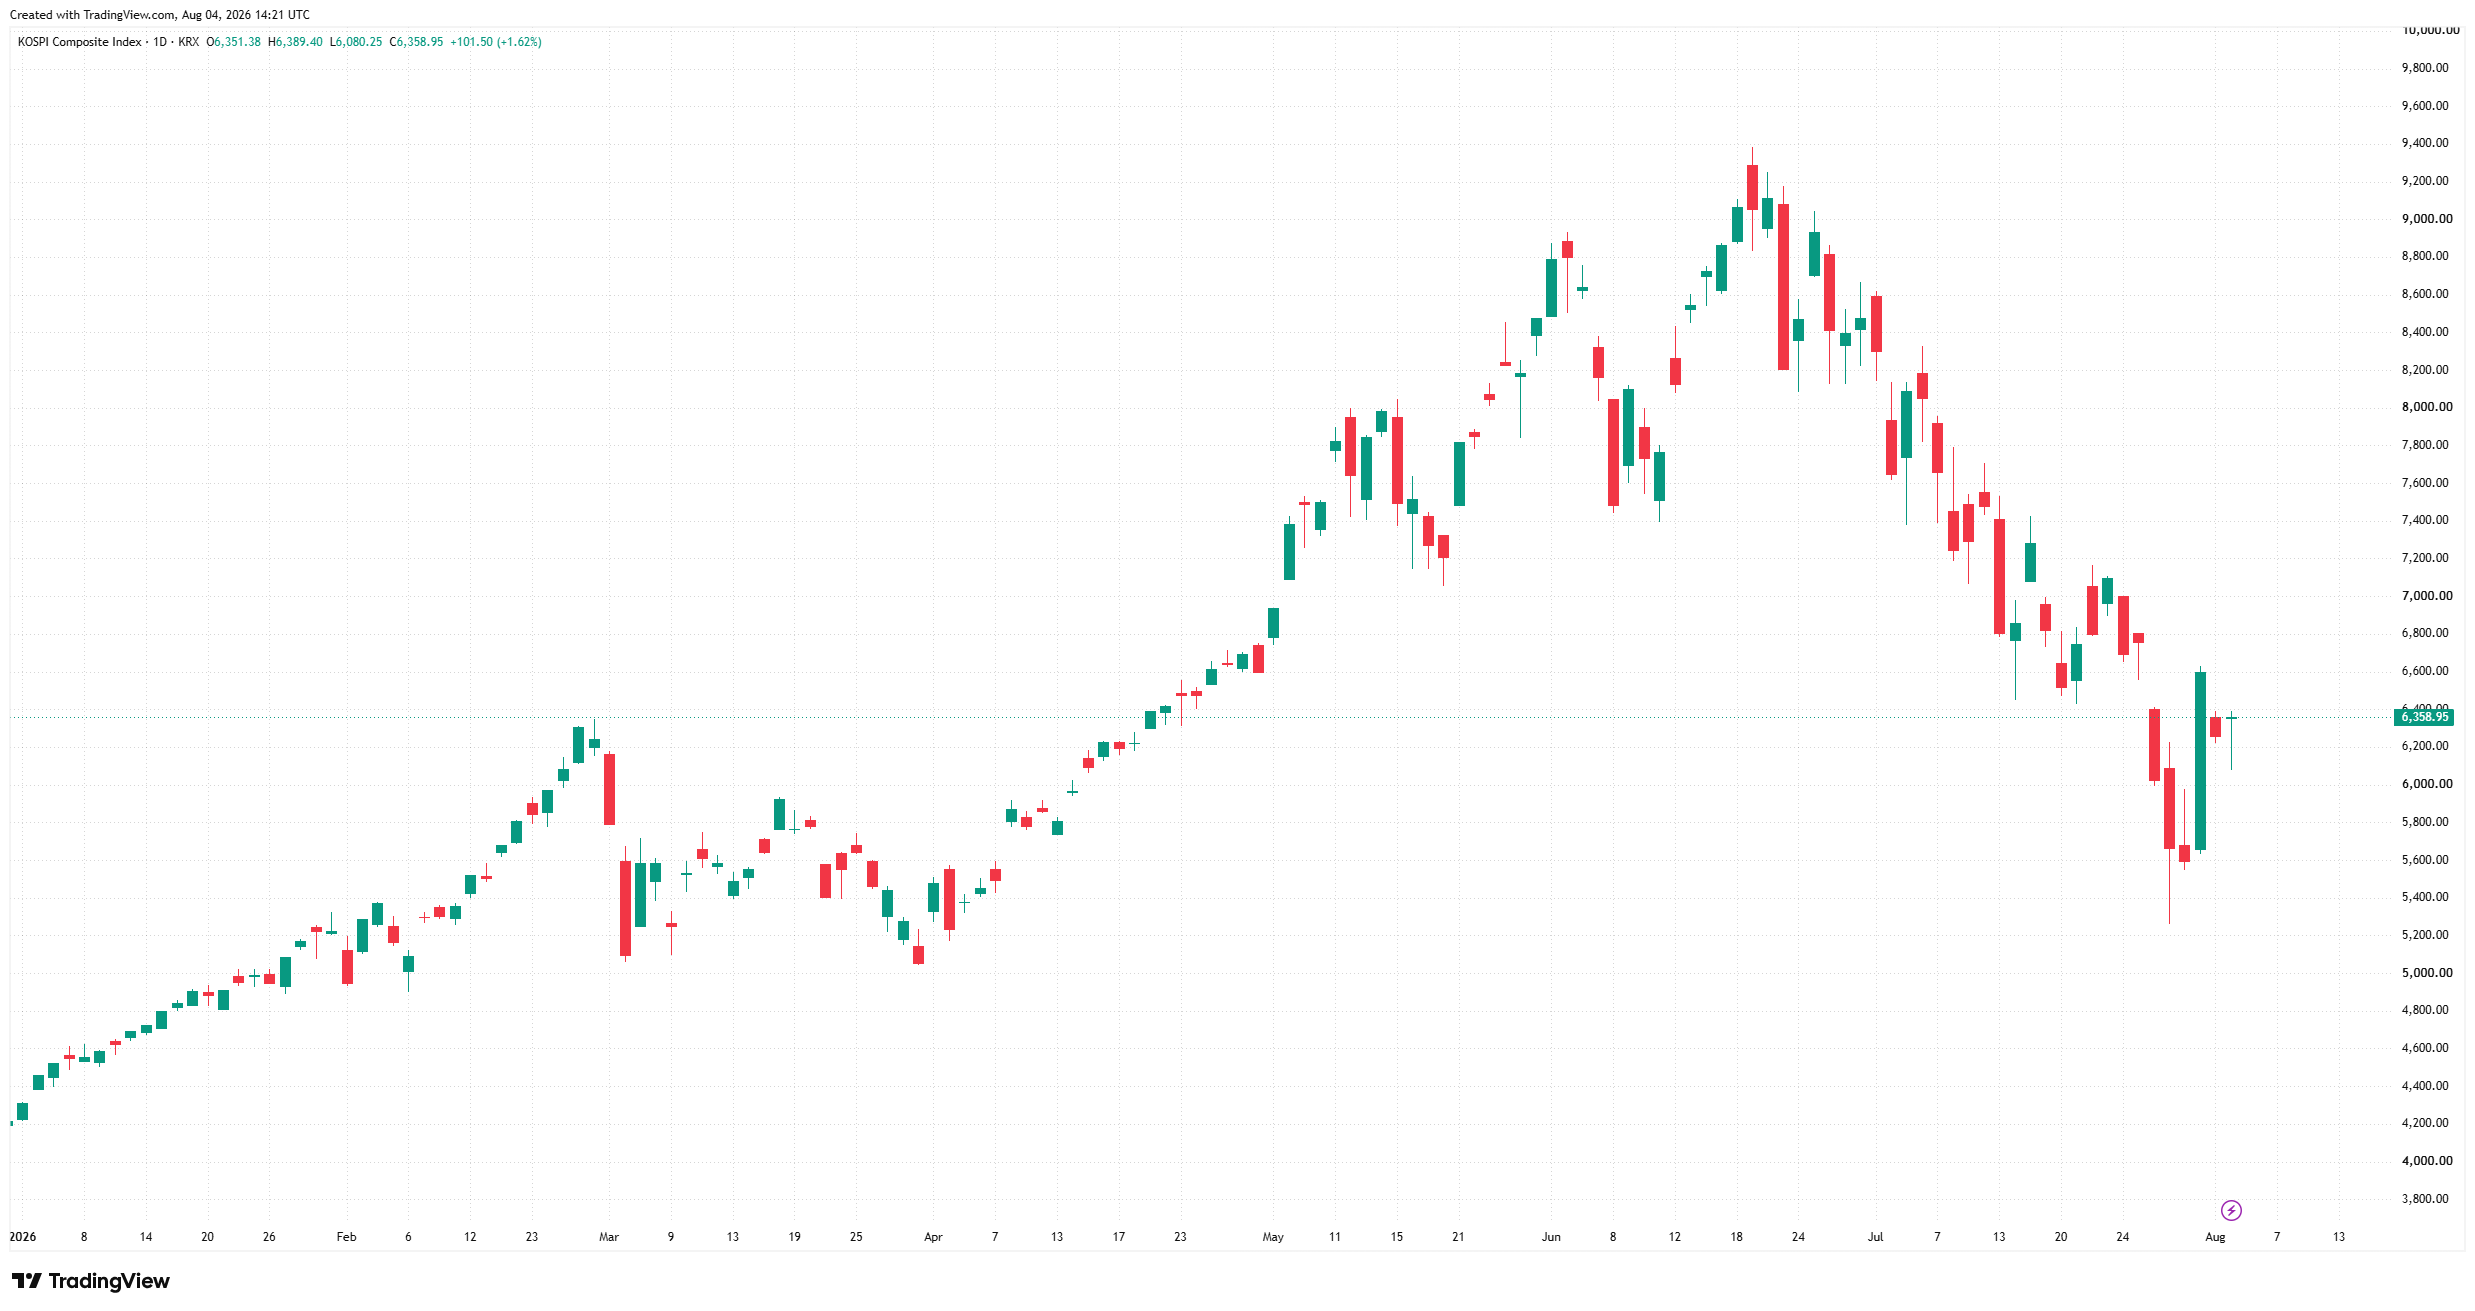
In Chart 1 above, the volatility suggested by the multiple circuit breaks is highly apparent. There are several dynamics in play behind these moves, however we are most interested in whether equity market volatility translates across to the bond markets, so next we will take a look at the yield curve shift and year to date volumes by quarter for South Korean government bonds.
As with almost every global issuer, South Korean government bonds (known as Korean Treasury Bonds or KTBs for short) are reported under MiFID. As is often the case for issuers within the Asia Pacific region it is reasonable to assume the majority of activity occurs domestically (i.e. within Korea), however a substantial amount is still captured under MiFID.
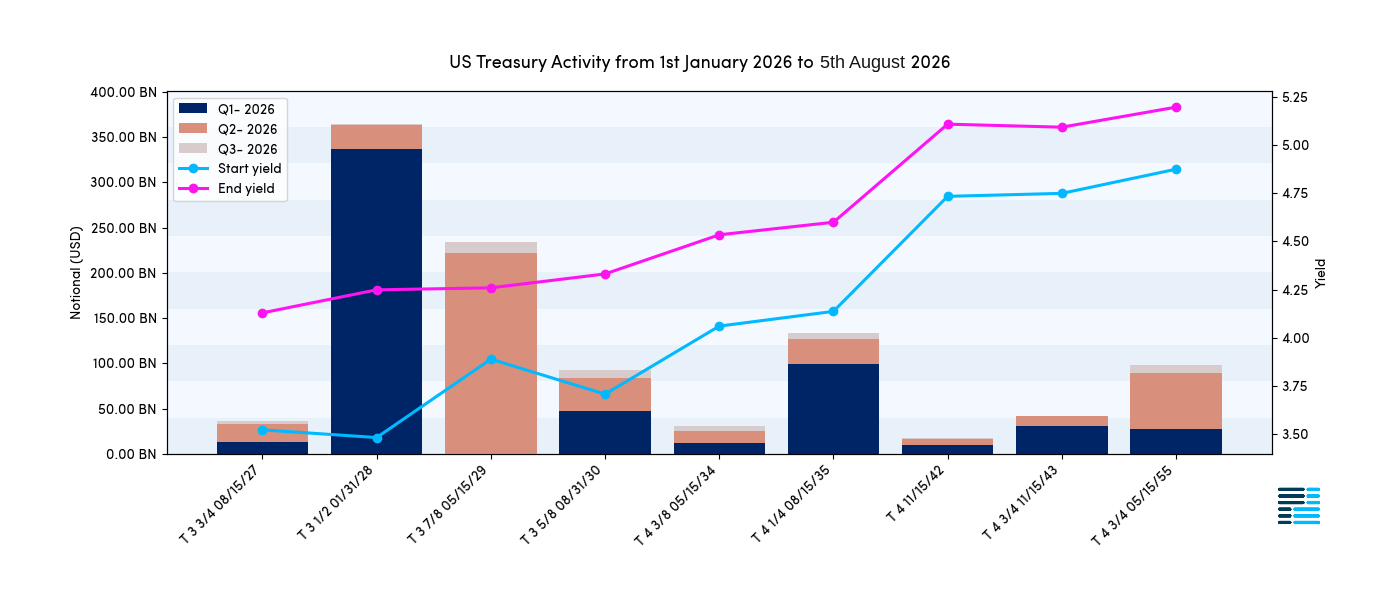
Whilst Chart 1 showed us that Korean equities have been highly volatile, the market still remains significantly higher than in January (despite a significant sell-off in June). Chart 2 above shows us that KTB yields have widened (i.e. the prices of KTBs have decreased), which typically suggests increased concerns about the Korean economy.
Volumes in Q2 were also generally higher than in Q1, whilst Q3 is only a few weeks old, so it is difficult to say at this stage whether the increased activity will continue. What this does show us however is that bonds and equities do not always follow the same path and (as evidenced above) it is not uncommon to see one asset class go up, whilst the other goes down5.
Exchange Traded Funds (commonly known as ETFs), are increasingly popular in the modern era, as investors (including retail) can gain exposure to a basket of securities, often focused around a particular theme (e.g. quantum computing) or a geographic region (e.g. Korea). Below we take a look at ETF volumes reported via MiFID, where Korea is referenced in the ETF name.
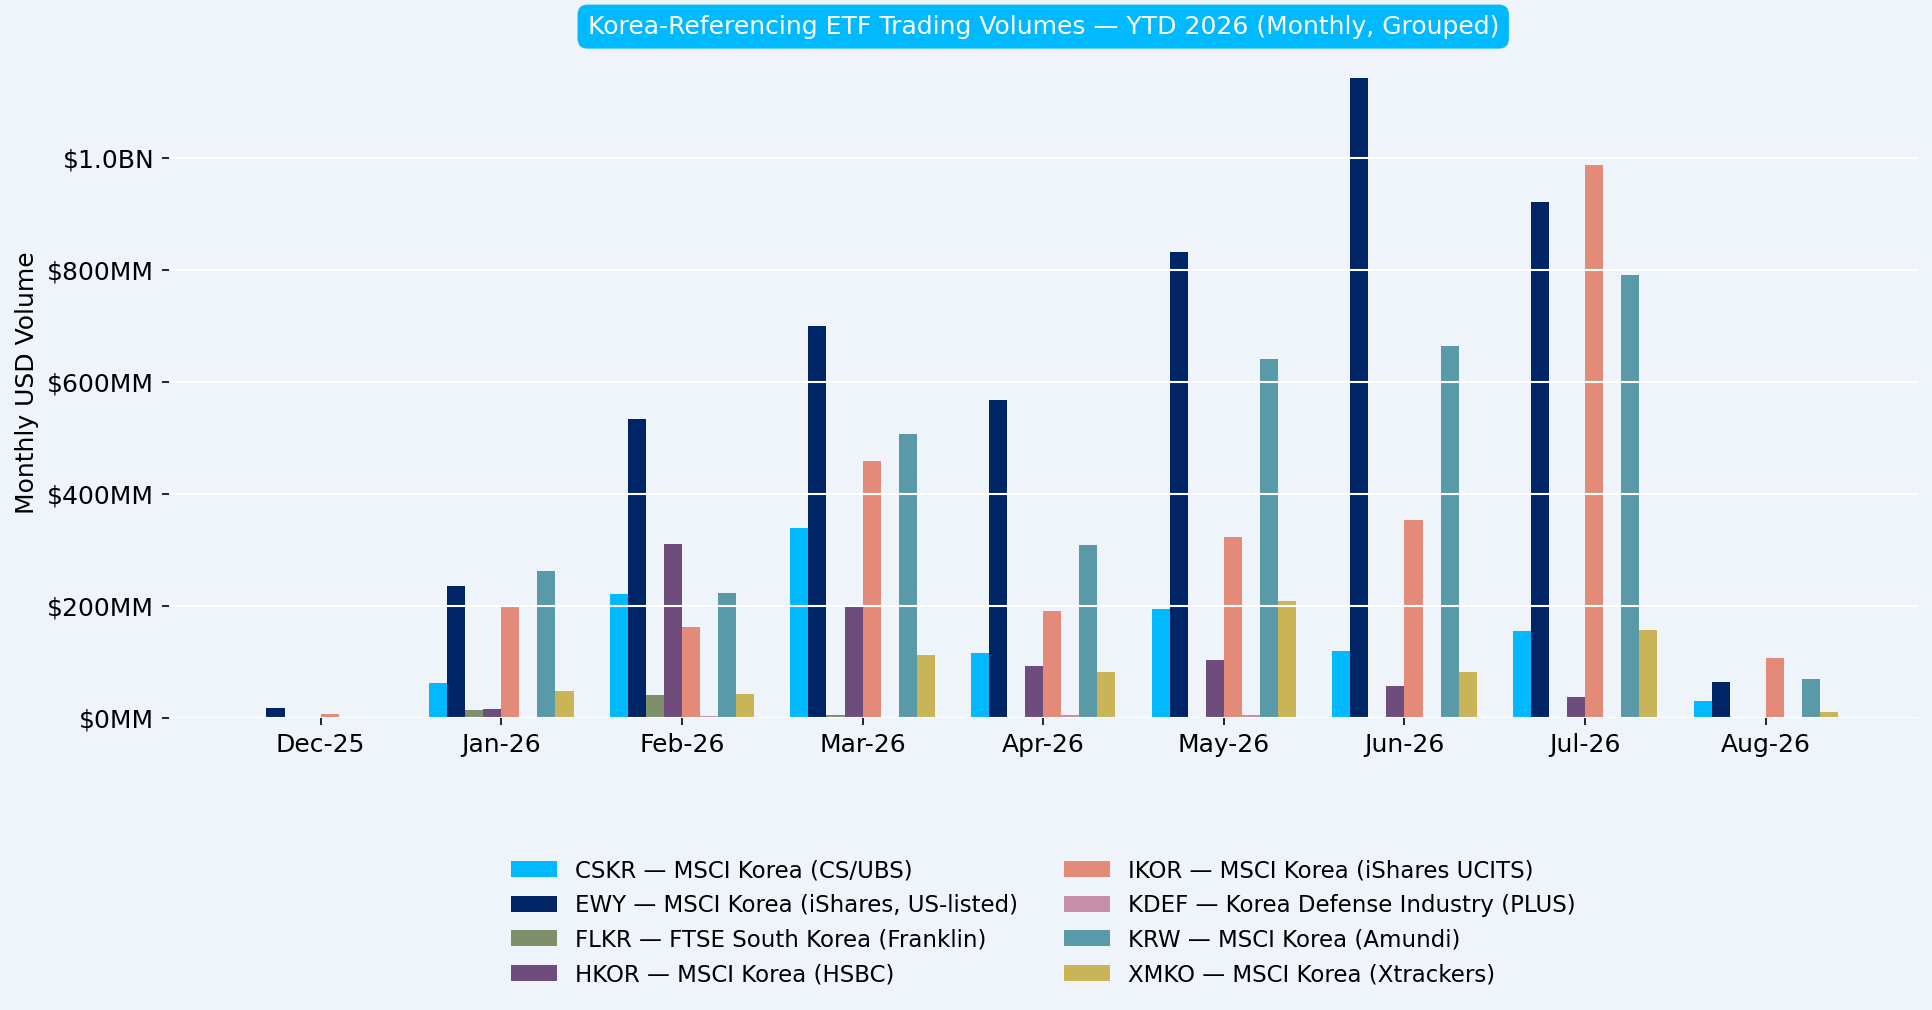
Chart 1 showed us that the equity market peaked in June and then sold off (whilst remaining higher than in January, at least at the time of writing). Above in Chart 3 we can see that ETF volumes show a similar (albeit not identical) pattern, gradually increasing, with EWY peaking in June and then others following suit in July.
This is logical, ETFs are actively traded by multiple types of investor and whilst many could hold bonds as well as (or even instead of) equities, due to the exchange-traded nature, they are often considered more liquid than bonds. Investors often prefer to gain exposure via an ETF than the underlying asset (hence the pattern we see in Chart 3 appears to closely track what we saw for equities).
Whilst IRS denominated in currencies other than USD, EUR and GBP have largely been (or will shortly be) de-scoped from MiFID price dissemination, there is still one repository that captures these; DTCC. DTCC actually captures the bulk of EUR, GBP and USD activity too, but that is a topic for another day. For now we want to focus on IRS denominated in Korean Won (KRW).
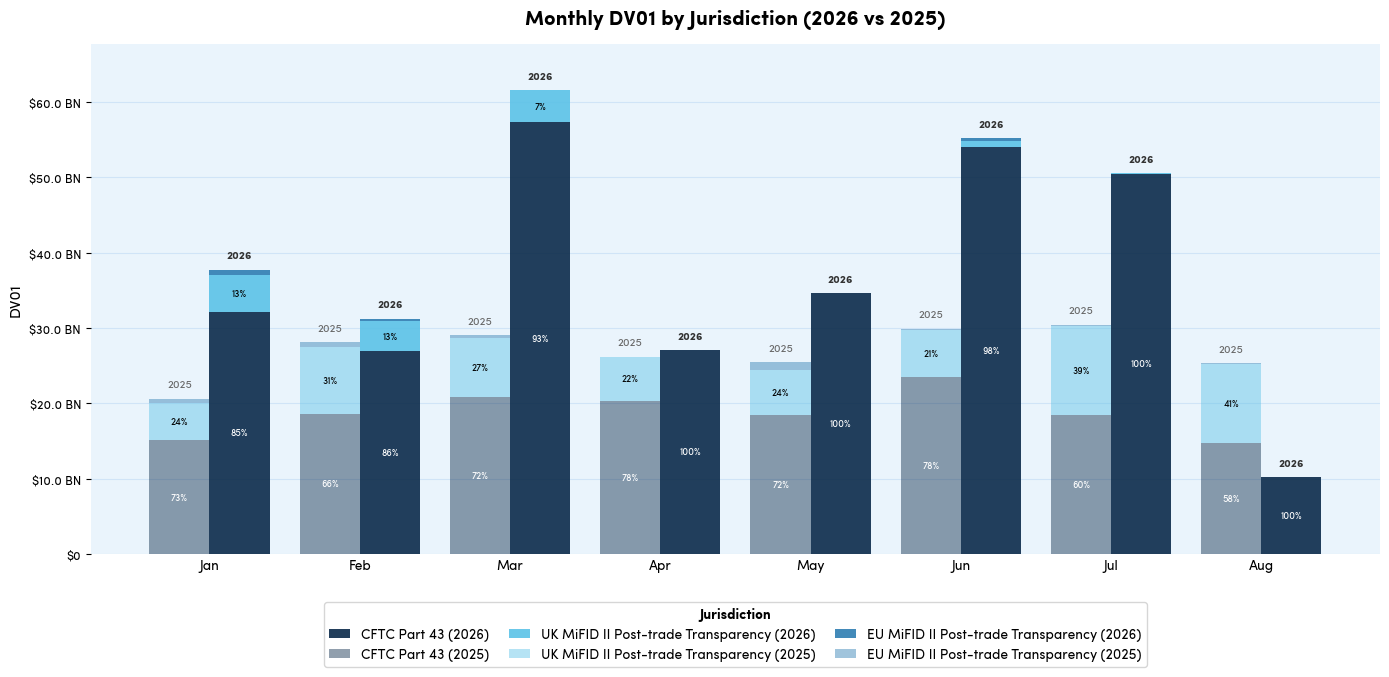
For Chart 4 we have used DV01, rather than notional volume as for short dated IRS the size can be very large (and it would completely skew the result). It is also worth noting that although DTCC doesn’t have the same deferral logic as MiFID, CFTC reporting does have notional caps, meaning the full volume is not shown for larger tickets.
Until recently there was a reasonable amount of KRW activity in the UK. The drop off doesn’t mean this activity has stopped, however under the new FCA transparency rules, it is not shown to the public (unless it occurs on venue).
ESMA has announced that along with the 3 aforementioned currencies, JPY will also be included, when their OTC derivative changes occur next year. So whilst we see a small amount of KRW activity in some months, this will completely disappear early next year.
The bulk of flow, as expected is reported via DTCC (noting that this still could include UK/European counterparts) and we can see that the majority of activity occured in March, with volumes picking up again in June and July. That said, the pattern does suggest that as the equity sell-off gained traction, IRS volumes once again picked up.
To complete the set of fixed income instruments, we finally turn our attention to credit default swaps (CDS). Single name CDS are not the most liquid instruments and sovereign CDS are sometimes no exception. However in the case of Korea there is a reasonably liquid market (liquid in the context of sovereign CDS).
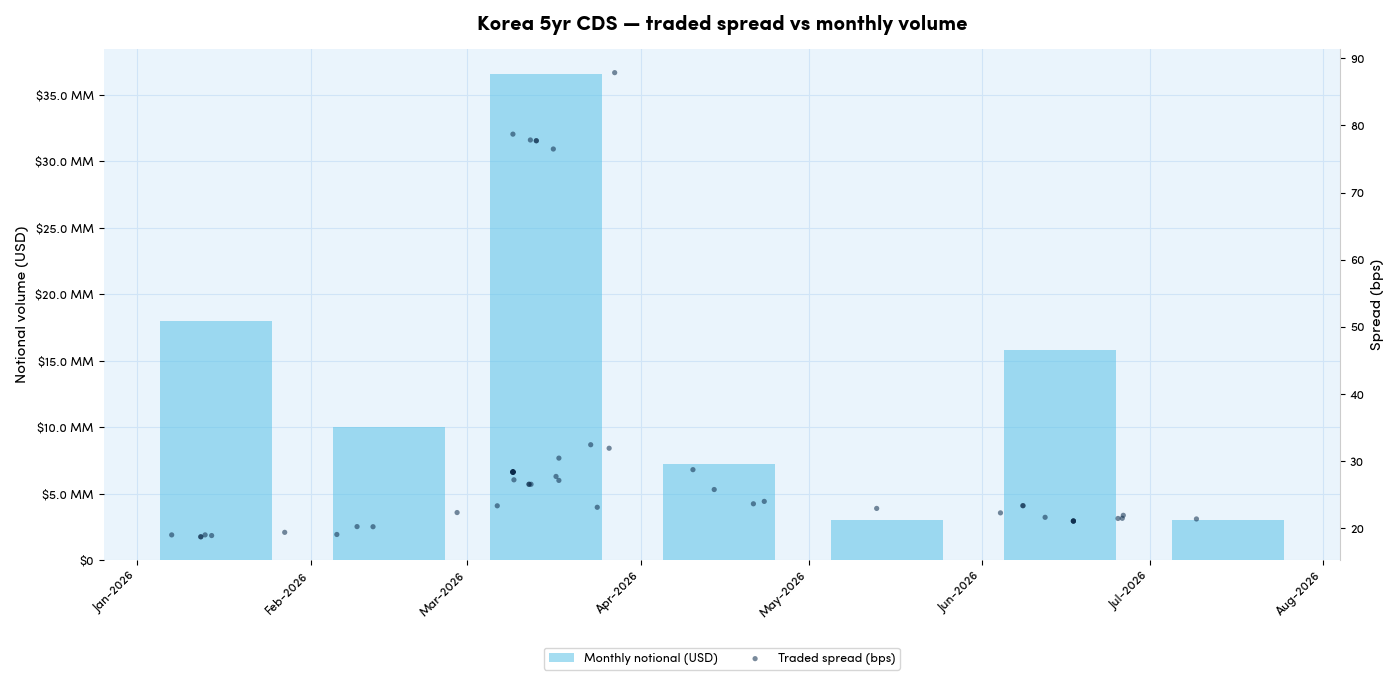
With CDS, the only liquid tenor is the 5-year, so we will focus on that, as off-the-run tenors can result in some quite unusual spreads. An initial look at Chart 5, shows us that CDS did not react in the same way as equities or ETFs, which suggests that the market was not overly concerned with the probability of a sovereign default.
This tells us more about the risk profile being created by the source of market volatility this year. Where equities track changes in relative value very closely, due to the importance of capital gains on equity investments, fixed income instrument pricing typically changes to a much smaller degree, reflecting the importance of the yield in delivering returns.
Two big dynamics; the growth of AI and hyperscaler companies, and the war in Iran, are driving volatility. War impacts the returns of corporates and thus inflation, creating pressure on bank rates, but sovereign defaults are generally rare (with some notable exceptions). When a government prints its own currency (unlike Eurozone members), and issues debt in that currency it dramatically reduces the probability of default to near zero.
We can however see that there was a significant widening at the end of Q1, which is likely caused by other macro factors, such as the Iran conflict (which started on 28th February)6. We also see volumes dramatically increase as spreads widened (this shouldn’t be a surprise, its not illogical to assume traders were rapidly looking to put on hedges with liquid instruments and CDS indices are often chosen specifically for this purpose).
Additionally, whilst there are a few high prints, these are outliers, with the vast majority of activity occurring around the 20-25bps level. We can see that spreads are around 10% wider, so its plausible (but unproven) that Korean equity market volatility has been a significant influence on the sovereign, although it is worth noting that 10% in this context is only around 2-3 basis points.
“Whilst it is evident that at points throughout the year we have seen not only increased volatility, but also increased volumes on securities and derivatives with Korean exposure it is not clear that the moves are solely related to the equity markets.
KOSPI has been making all the headlines, but the geo-political situation invariably also leads to increased activity and (as is the case with both bonds and CDS) yields/credit spreads widening.”

1https://www.bbc.co.uk/news/articles/c4gdzlzprv1o
3https://nspgroup.com/insights/investment/market-volatility-march-2026/
5https://arxiv.org/pdf/2603.03213
6https://edition.cnn.com/interactive/2026/05/politics/iran-war-key-moments-vis/index.html

Original photograph taken by Richard Hadley
Dan Barnes - Dan is a highly experienced market commentator and founder of multiple media ventures including Trader TV and The Desk.
He is contributing as a guest editor for Propellant Insights ahead of starting a new venture in Q4 this year.
Vidal Mehra - Vidal is Chief Product Officer for Propellant Digital and the lead author for Propellant Insights.
He has been working with financial institutions for over 20 years across multiple disciplines including front office and consulting roles.

Helena Roughton - Helena recently joined the team as a Product Manager, bringing extensive MiFID policy experience having previously worked at AFME.
She also brings product remediation and data analysis experience from the Bank of New Zealand.

%20(10).png)
%20(9).png)