
This week, we span the Atlantic, taking a look at volumes across MiFID and FINRA TRACE data to determine overall volumes in USD denominated bonds.
A common question we get asked is: what percentage of the USD market does MiFID represent?
This is a difficult question to answer precisely, so it is necessary to first define a suitable scope.
Firstly, as FINRA do not release full details for US Treasury transactions (only on-the-run activity is posted), for now we will exclude those. Additionally, other sovereign issues are not typically reported via TRACE (unlike MiFID), so for consistency we will also de-scope those. Next, we can reduce further and only consider USD bonds (as TRACE does not include non-USD transactions)
What does that leave within scope?
In this issue, we will focus on Corporate Bonds (including financials) and further exclude Public Bonds (in MiFID terminology) and Agency Bonds (from the FINRA data).
Firstly, we take a look at the overall USD volumes (excluding sovereigns, although US Treasuries were examined within MiFID in Propellant Insights Issue 3), and compare MiFID vs TRACE for 2026 year-to-date.
As many market participants would expect, Chart 1 shows that the volumes disseminated via TRACE are vastly higher than those published via MiFID, with TRACE volumes making up over 80% of the combined USD activity.
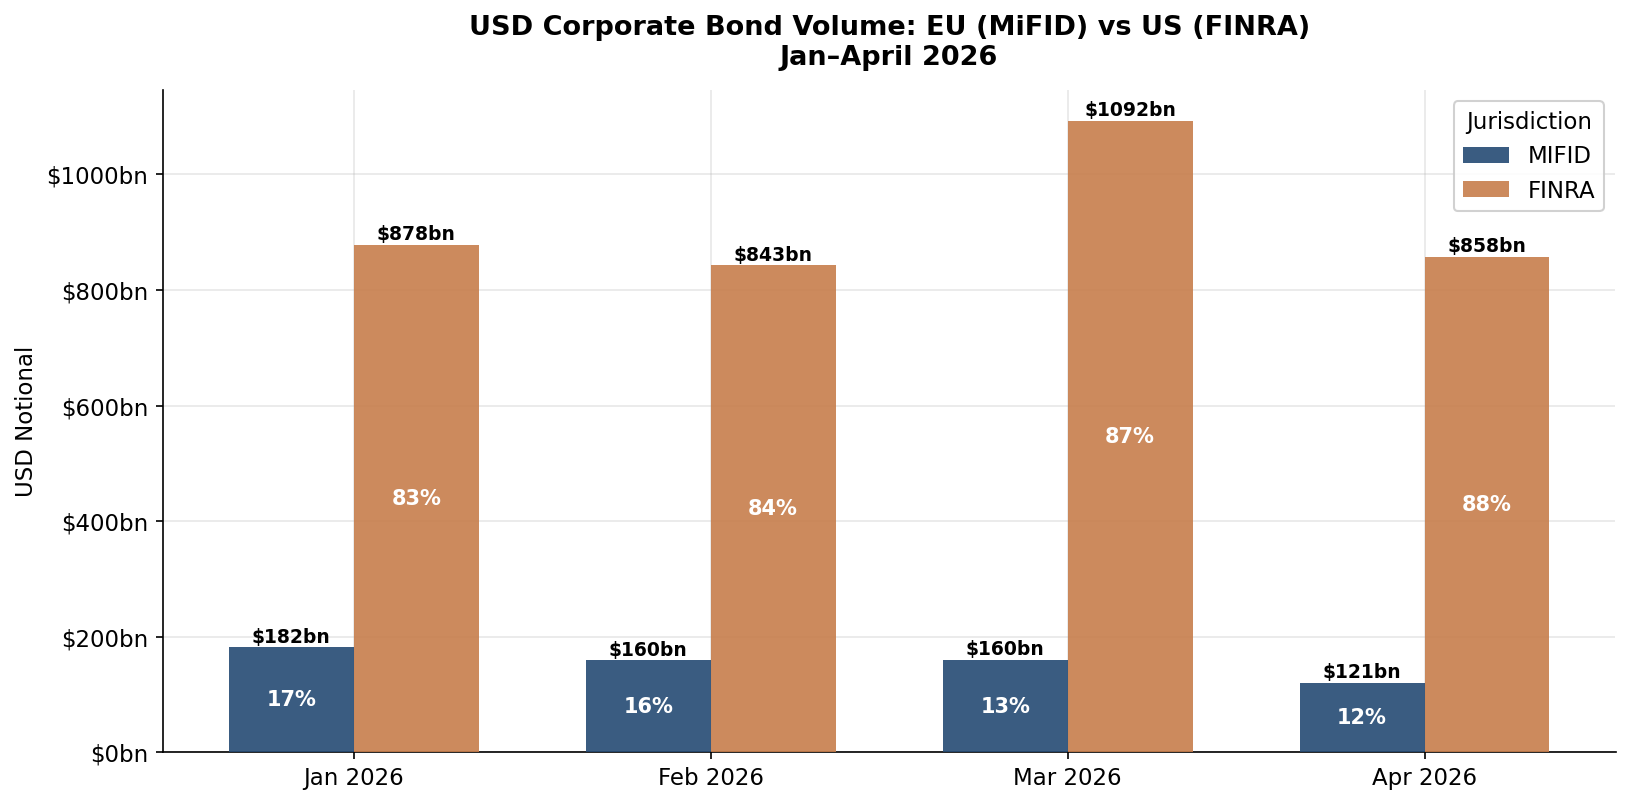
It is logical that USD corporate bond activity would be concentrated within the US. Hence, whilst Chart 1 is unlikely to raise many eyebrows, it is useful to be able to empirically demonstrate what many have long suspected.
In the next section, we dive deeper into the data, focusing on a smaller sample set, aiming to provide a like-for-like comparison on a subset of ISINs as some ISINs will just trade in the US (and some potentially predominantly outside the US).
We now take a deeper look at the data and compare flows across ISINs that exist in both datasets. This allows us to gauge a true indication of the proportional volumes within MiFID and TRACE (when comparing like-for-like, rather than overall volume).
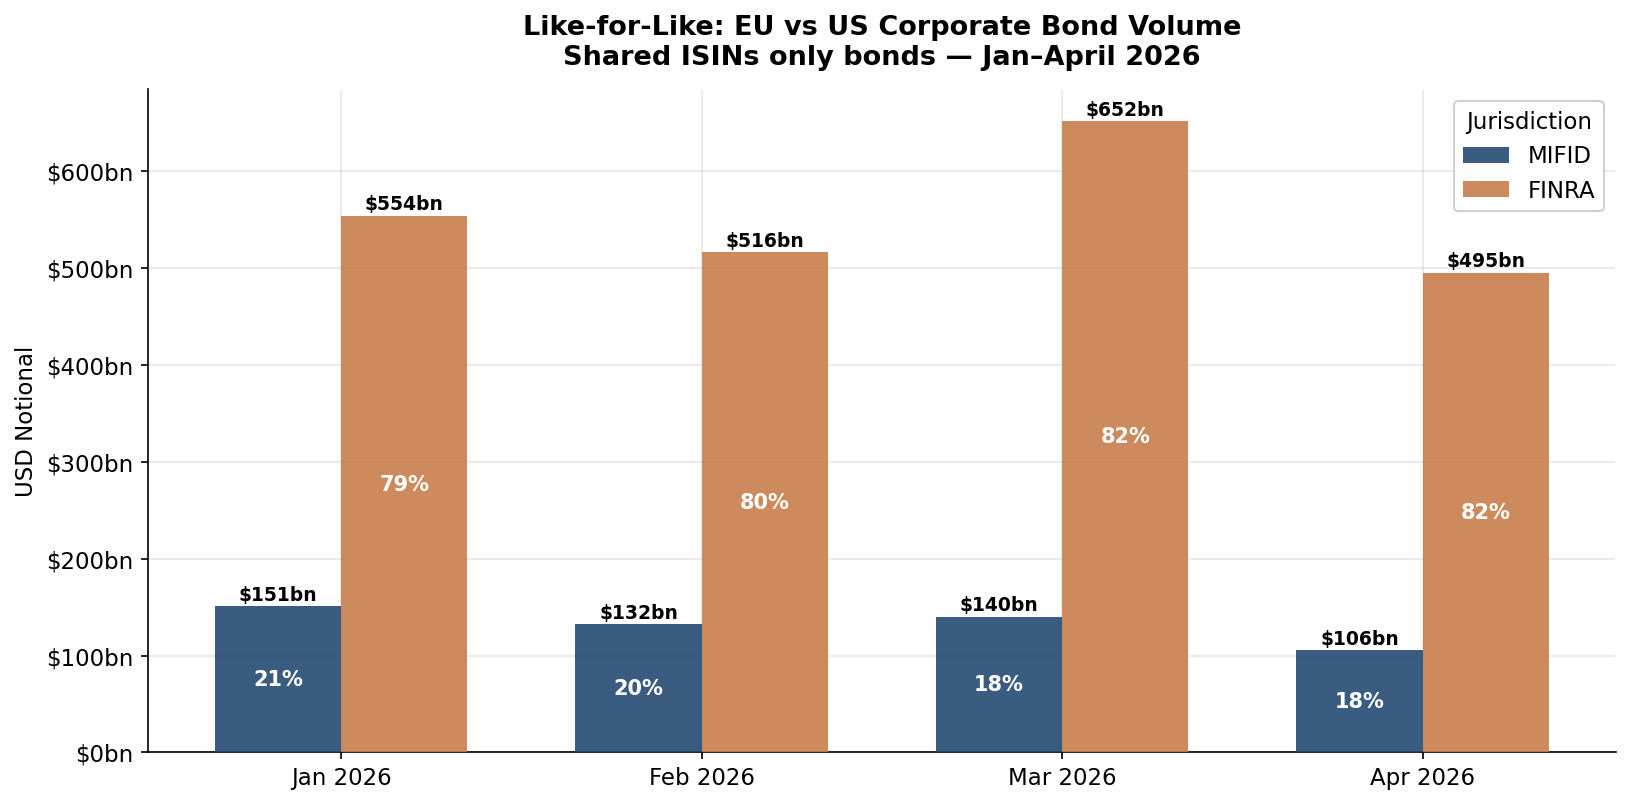
A similar trend can be observed in Chart 2, with volumes reported via TRACE significantly higher than MiFID. This confirms that not only is the vast majority of USD corporate bond activity transacted in the US, but that even after removing ISINs that never trade in Europe, the trend remains almost unaffected.
Finally this week, we break out the 'capped' proportion of FINRA volume in Chart 3 below. Unlike MiFID, which either omits the volume or shows it in full, TRACE reports are capped at USD 5 MM for Investment Grade (IG) bonds and USD 1 MM for High Yield (HY) bonds.
Deferrals exist within MiFID, so if a trade for USD 10 MM on a liquid IG credit took place in Europe, the trade would likely print with the volume omitted on T+1 and then one week later a subsequent report would be released containing the volume. TRACE takes a different approach, instead unmasking the volume on any capped trades after six months.
With a sizeable proportion of volume capped, the percentage of USD corporate activity occurring in the US is likely to be even larger than suggested in Charts 1 and 2.
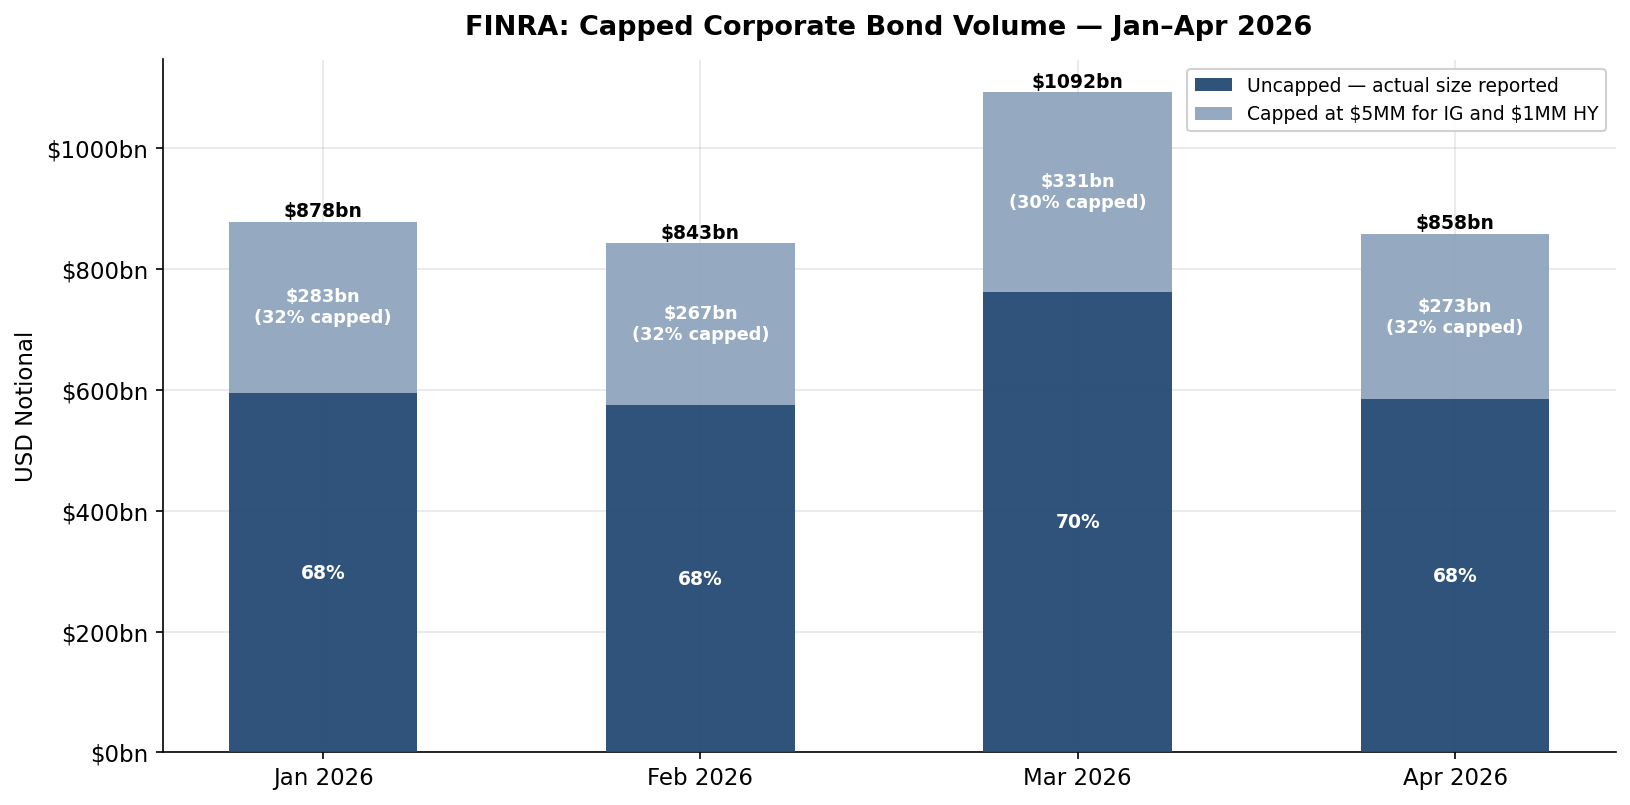
“Capped volumes under TRACE represent around 30% of Corporate Bond volumes, additionally with the new ESMA framework only coming into effect on 2nd March 2026 it is likely there are additional trades (at the time of writing) to be added into both datasets. It will be interesting to compare numbers again after the TRACE reports for this period are unmasked and the deferred reports in the EU are fully released.”