

.png)
In the last issue, we reviewed the first week of the new ESMA transparency regime. This week, we look at both the ESMA and the FCA regimes, considering some of the differences and analysing several larger trades from December that were deferred for 3 months.
Before examining the breakdown of the deferral lengths, we first review the recent changes (full details in Propellant Insights Issue 23).
ESMA launched a new transparency regime for bonds on Monday 2 March 2026. Unlike the FCA, ESMA did not change its OTC derivative rules; these will instead be updated in March 2027 .
The key change is the removal of indefinite aggregation (which impacted sovereign bonds) along with changes to the way liquidity is assessed (which in practice means more trades get reported in a shorter time frame).
Chart 1 below shows a familiar view, highlighting the dramatic increase of real-time (and near-time, i.e. within 15 minutes) reporting of sovereign and corporate bond trades.
.png)
Across the board, we see a large increase in terms of real-time reporting. However, the new regime is not just about real-time, it also increases transparency for larger trades, as they are not deferred for as long. Chart 2 below illustrates the breakdown in percentage terms, by deferral type.
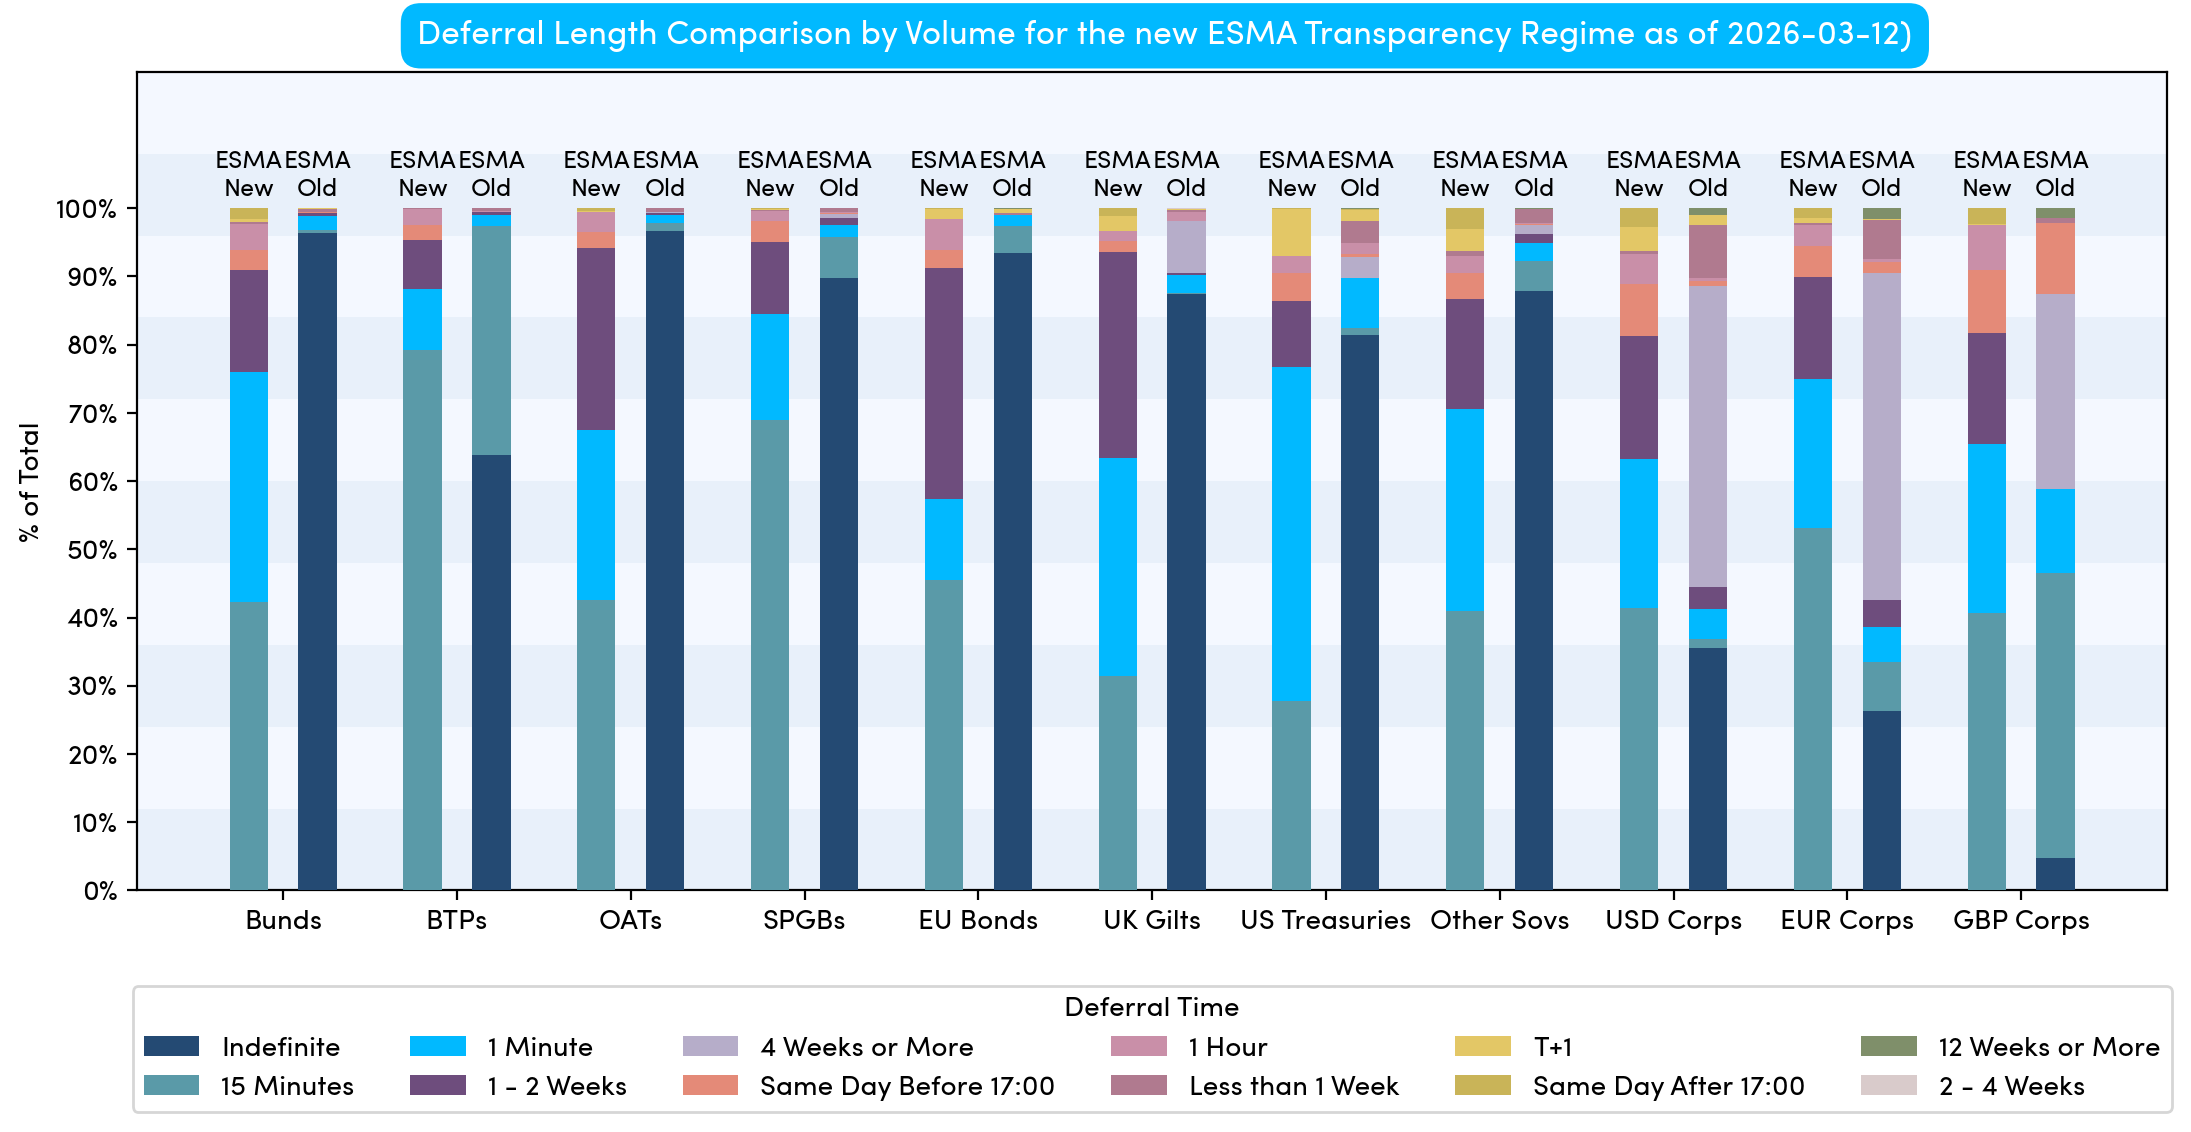
As with the real-time view shown in Chart 1, there is a significant increase in near and real-time reporting across the board. As previously mentioned, the removal of indefinite aggregation (which made up more than 90% of volumes for some sovereign bonds) is arguably the most notable change. This now ensures a transaction level report is provided for every trade (aligning with the new FCA approach), something that may appeal to traders and data scientists alike.
Whilst the focus has been on ESMA over the last couple of weeks, the FCA launched their new transparency regime back in December. As with ESMA the impact was immediate, with real-time reporting significantly increasing for all categories of bonds.
In addition to bonds, the FCA regime also included OTC derivatives, meaning the scope differs from the current ESMA equivalent. The FCA regime only mandates the reporting of activity on five specific reference rate families: EURIBOR, ESTR, SONIA, SOFR and FED FUNDS.
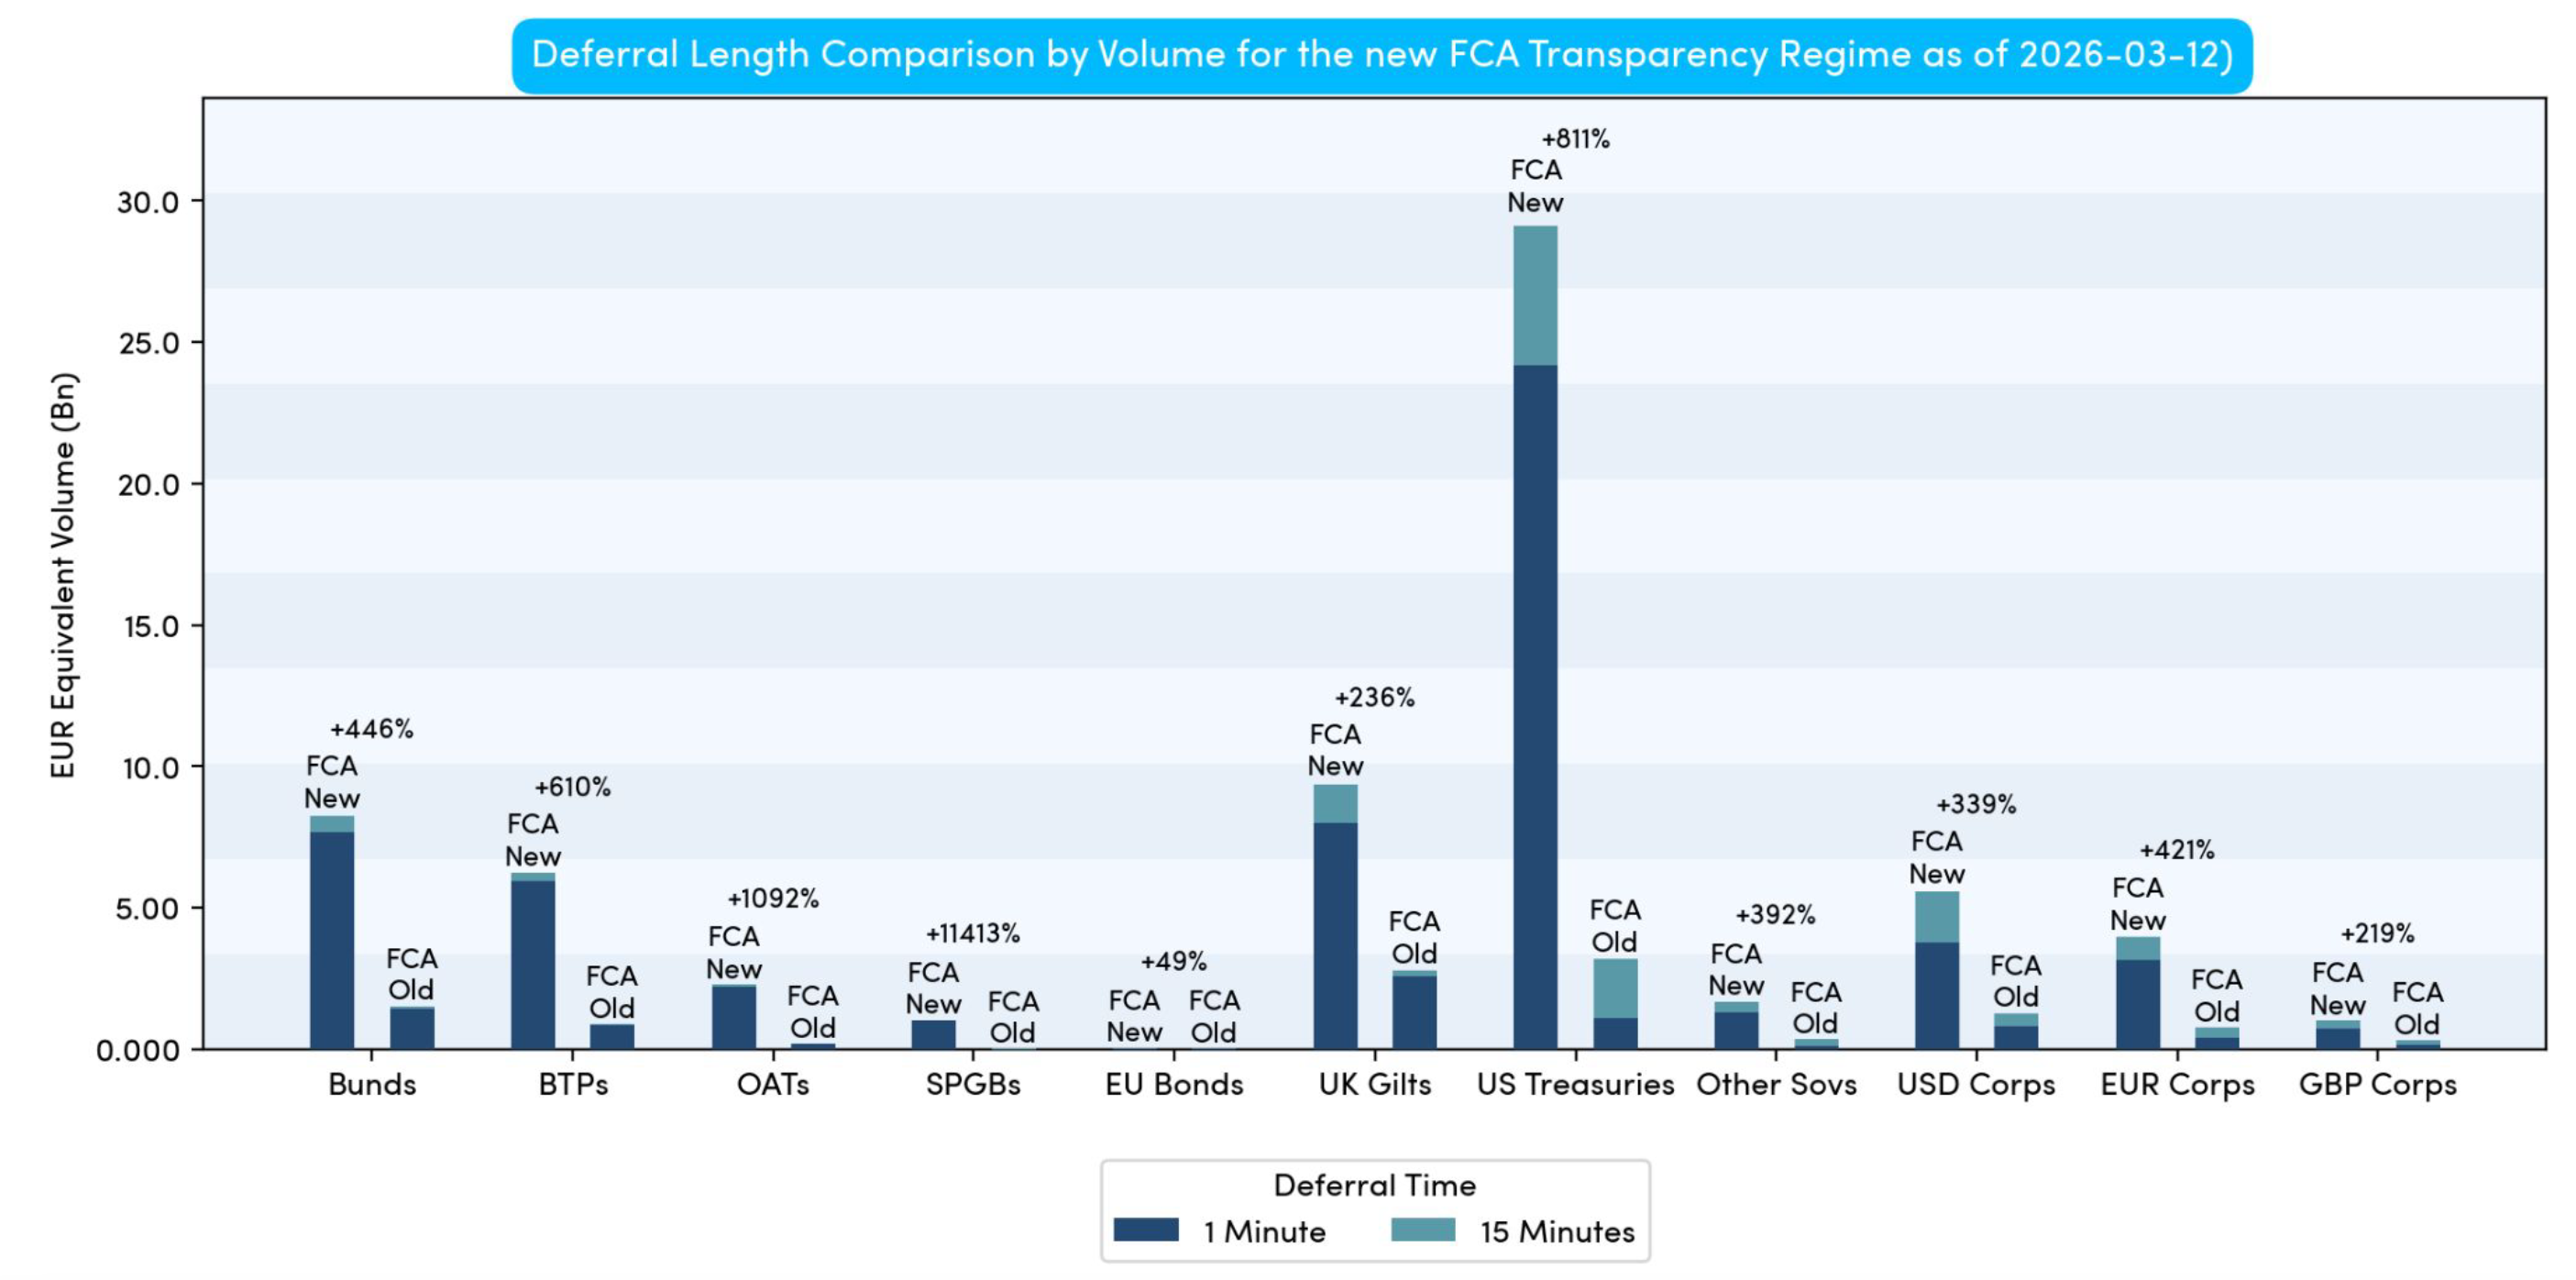
With the FCA regime going live in December, we now have a significant amount of data across multiple deferral buckets, providing a very high level of confidence that the increased transparency is not due to a few outliers, but is both observable and measurable. Chart 3 below firstly considers the breakdown of real-time reporting.
It is again logical to consider a percentage view to show the breakdown, this time across the full range of deferrals rather than only trades reported within 15 minutes.
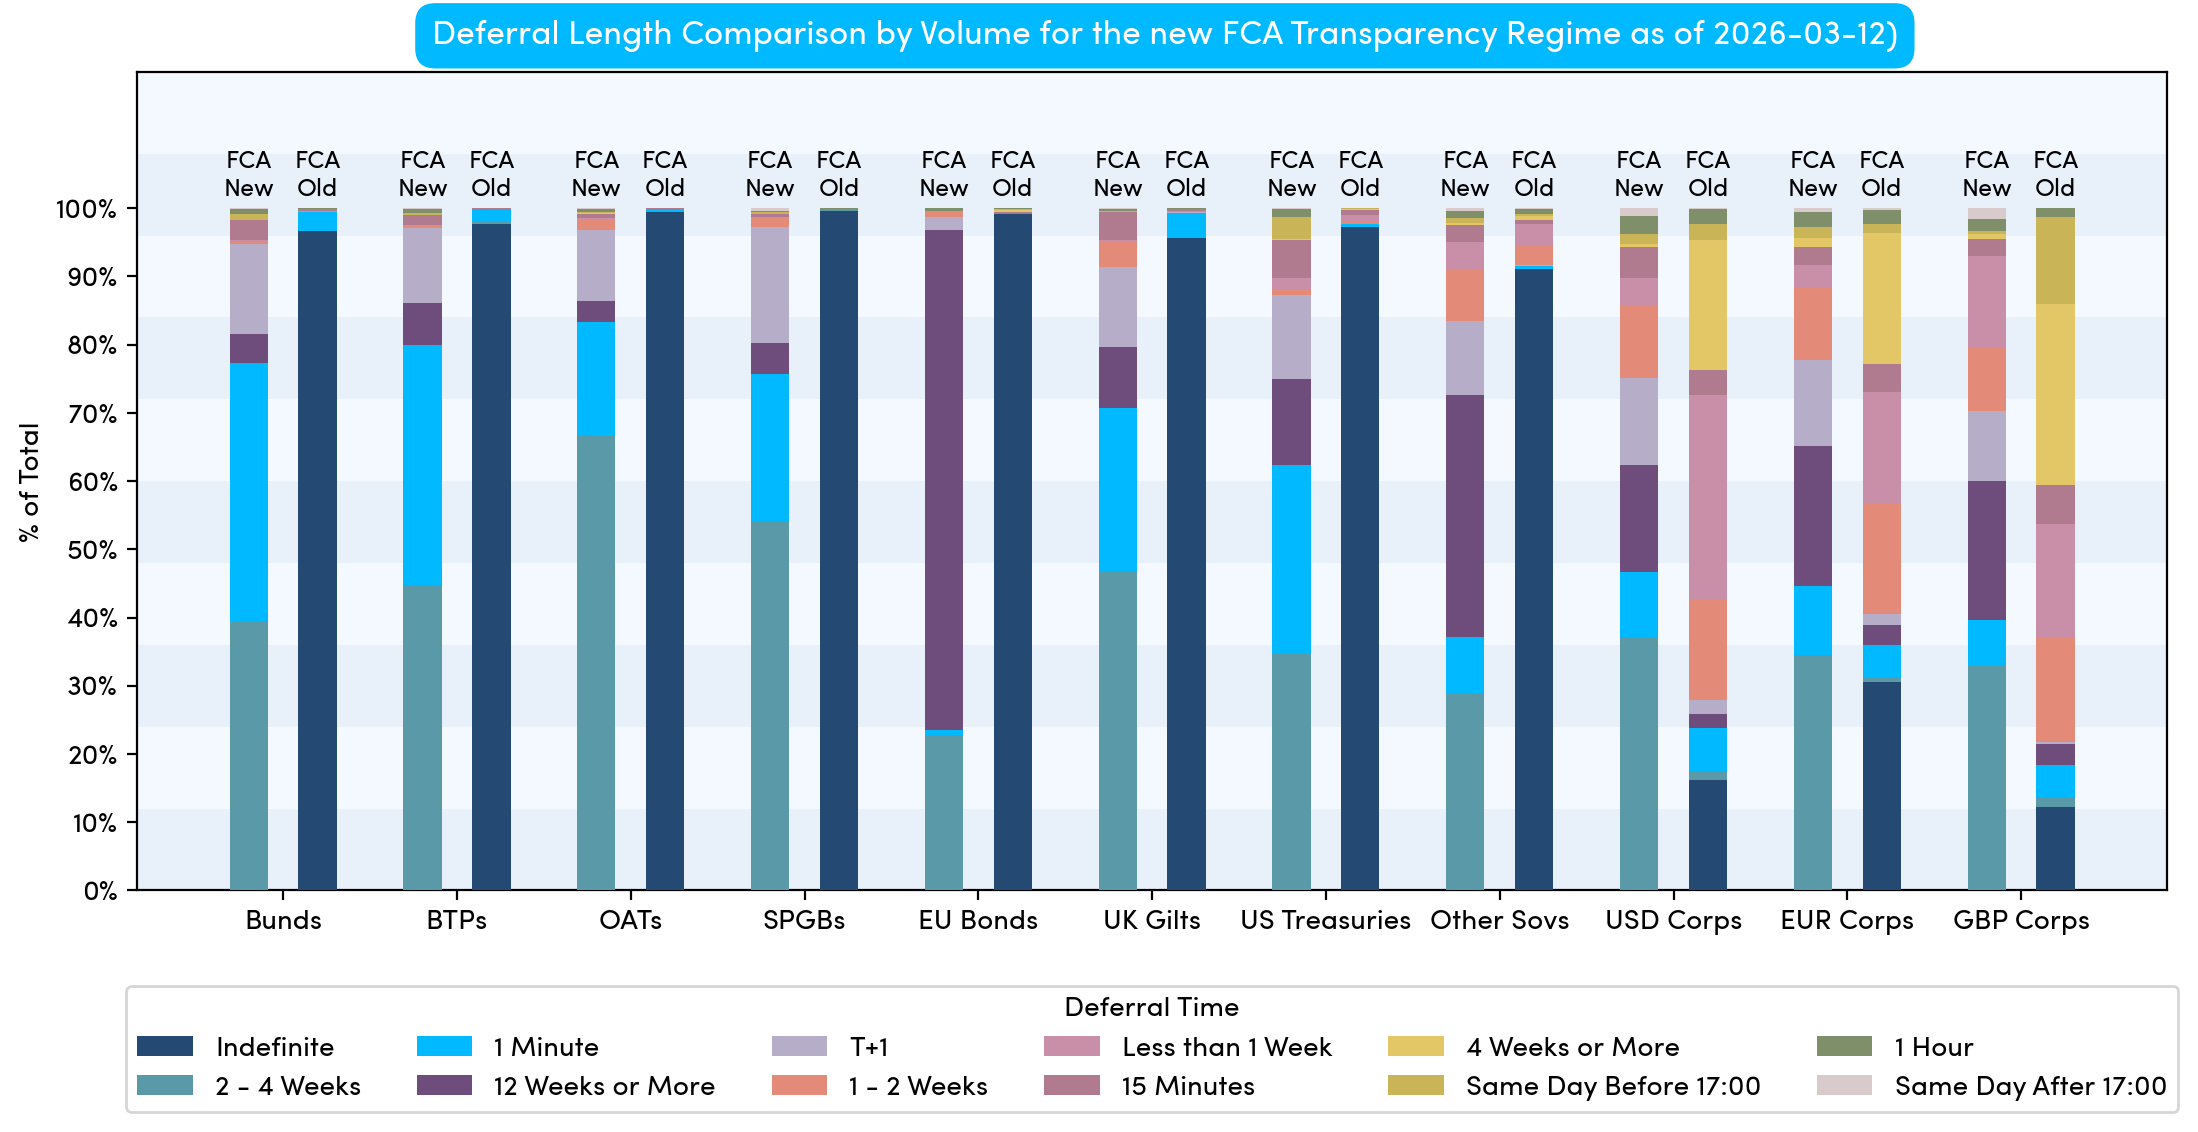
Chart 4 provides the first clear view of the effectiveness of the new FCA regime. Whilst real-time activity has previously been observable, up until now there has not been a meaningful amount of data for the three-month deferral bucket.
With just under 2 weeks of data, we can already see a trend forming, particularly for certain bond types. European Union bonds, for example, have a much higher percentage of volume deferred for three months than other categories.
This is likely explained as they typically trade in large institutional size, with less retail flow than other categories. It is also important to note that EU bonds have a lower deferral threshold than some of the liquid sovereign issuers.
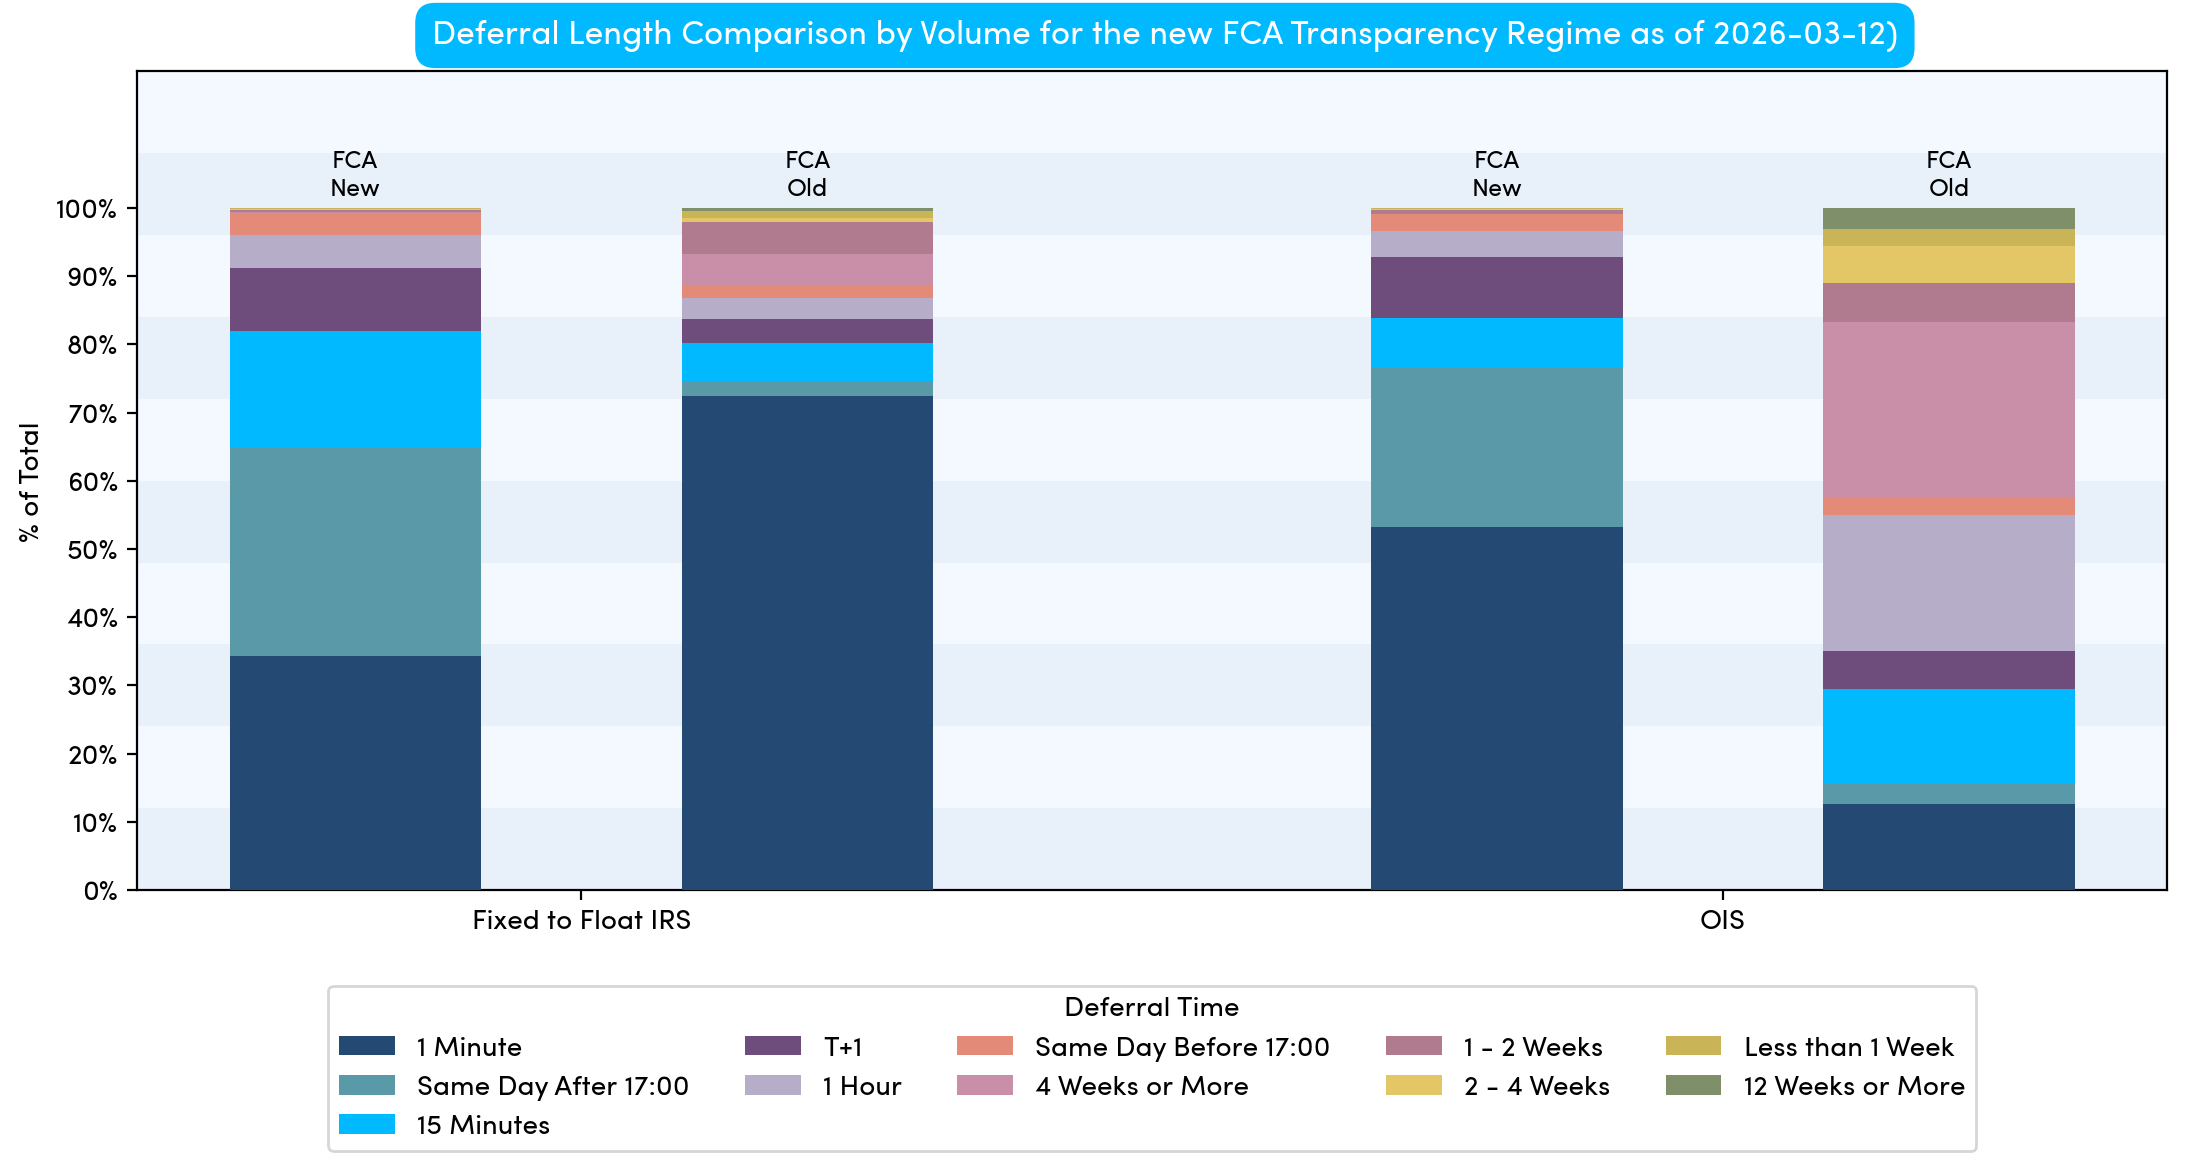
Moving onto Interest Rate Swaps (IRS), as there are fewer instrument categories, it is very clear that the vast percentage of traded volume is now reported same day, as illustrated in Chart 5..
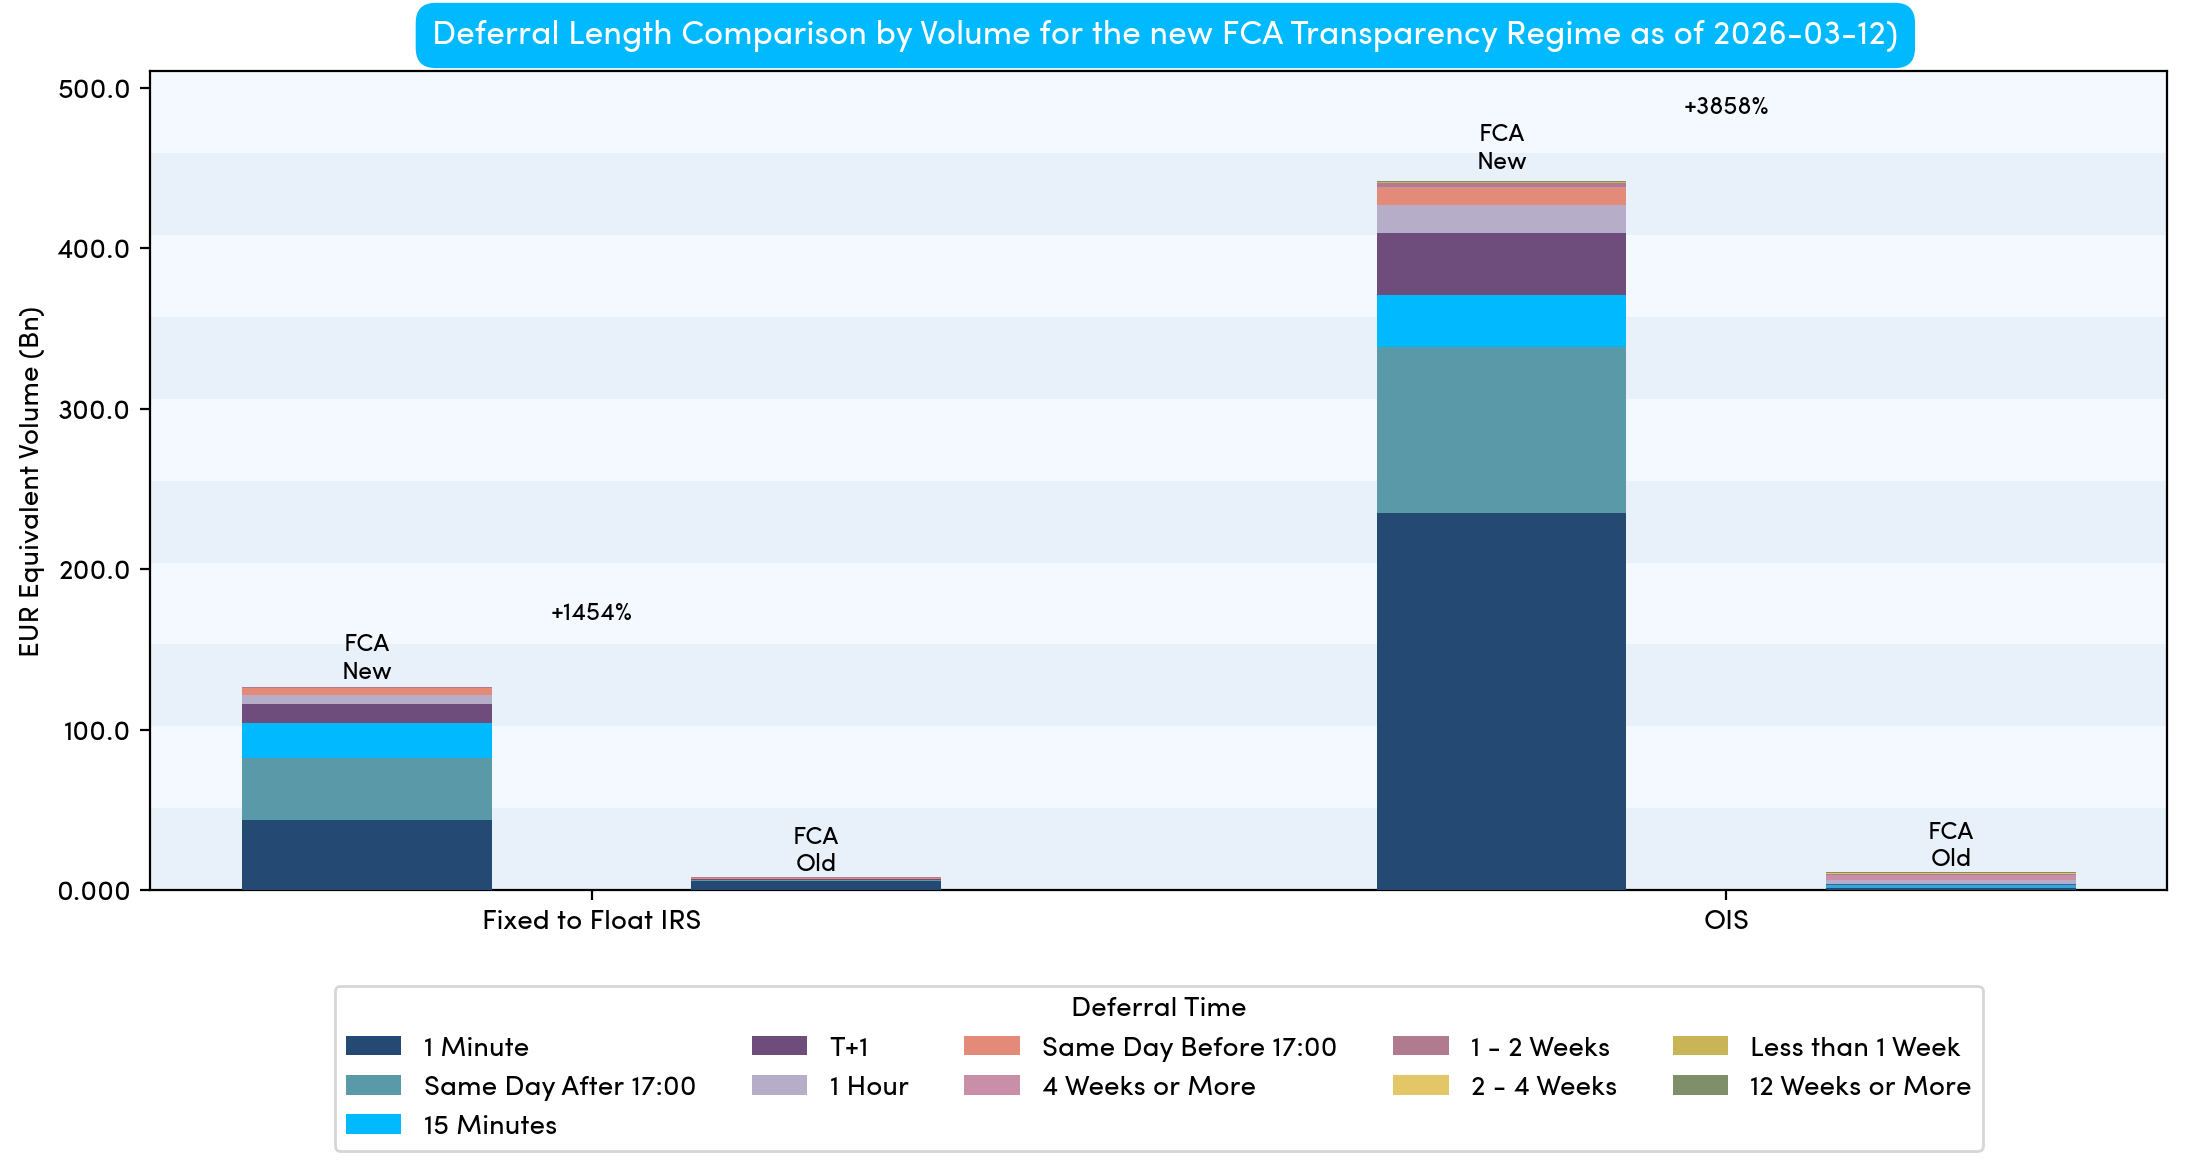
In absolute terms, IRS volumes are vastly higher (with percentage increases in the thousands of percent). This reflects the new rules allowing the reporting of very large notional sizes (up to 2.5 billion of the traded currency on some short-dated contracts).
Given that short-dated contracts naturally trade in much larger sizes than long-dated contracts, the absolute volumes reported are significantly higher. An example of this can be seen by looking at the SONIA (GBP) OIS curve in Chart 6
Chart 6 below shows how heavily skewed volumes are to the front end of the curve. It also illustrates the rate shift between December and the previous week, highlighting how MiFID data is not just valuable for assessing swap volumes, but also for monitoring price volatility..

Our analysis concludes with a breakdown of IRS volumes in percentage terms. Unlike bonds, where the longest deferral is three months, for swaps (reported via the FCA), the largest contracts have the price reported at EOD and the volume deferred until the end of the following quarter. Therefore, more volume from trades in December is expected to appear later this month.
.png)
.png)
.png)