%20(7).png)
On Monday 22nd June this year, the UK Bond Consolidated Tape (CT) launched. Early analysis of data shows low volumes reported in real-time versus expectations, and so we look at the scope of the tape and consider whether the transparency landscape has changed, or whether it is too early to tell.


The eagerly awaited UK Bond Consolidated Tape (CT), under the supervision of the Financial Conduct Authority (FCA), went live on Monday 22nd June. To provide a full picture so far, we first need to consider the scope of the tape, and which debt instruments are excluded.
The reporting venues are defined1 as follows:
There are unlikely to be any surprises there, so we move on to the covered asset classes which are determined* by CFI Code:
Whilst the tape is referred to as the UK Bond CT, we can see that a more accurate description might be the ‘UK Debt Instruments CT’ as many ‘bond like’ instruments are also included, which are commonly referred to and treated like bonds by traders and other market participants.
A number of notable debt instruments were not on the list shown in figure 1. The omissions are defined as out-of-scope for the tape and these are shown in figure 2 below and it is apparent this particularly affects structured and asset-backed traders.
Money market instruments are another interesting point. They are technically outside the scope of MiFID reporting (hence also outside the scope of the CT), however prior to the CT launch, we did observe significant volumes reported (see Page 6).
.png)
We have looked at the above instruments in previous editions of Insights, with our review of the first week the tape went live in Issue 40 and a dive into the mysterious world of category 2 instruments (which have their deferral times set by the trading venue), back in Issue 28.
We also previously forecast our expectations of what the likely volumes omitted from the tape (based on the above scoping) were likely to be in Issue 39. Today with nearly two months of data we can now qualitatively assess what the actual volumes have been.
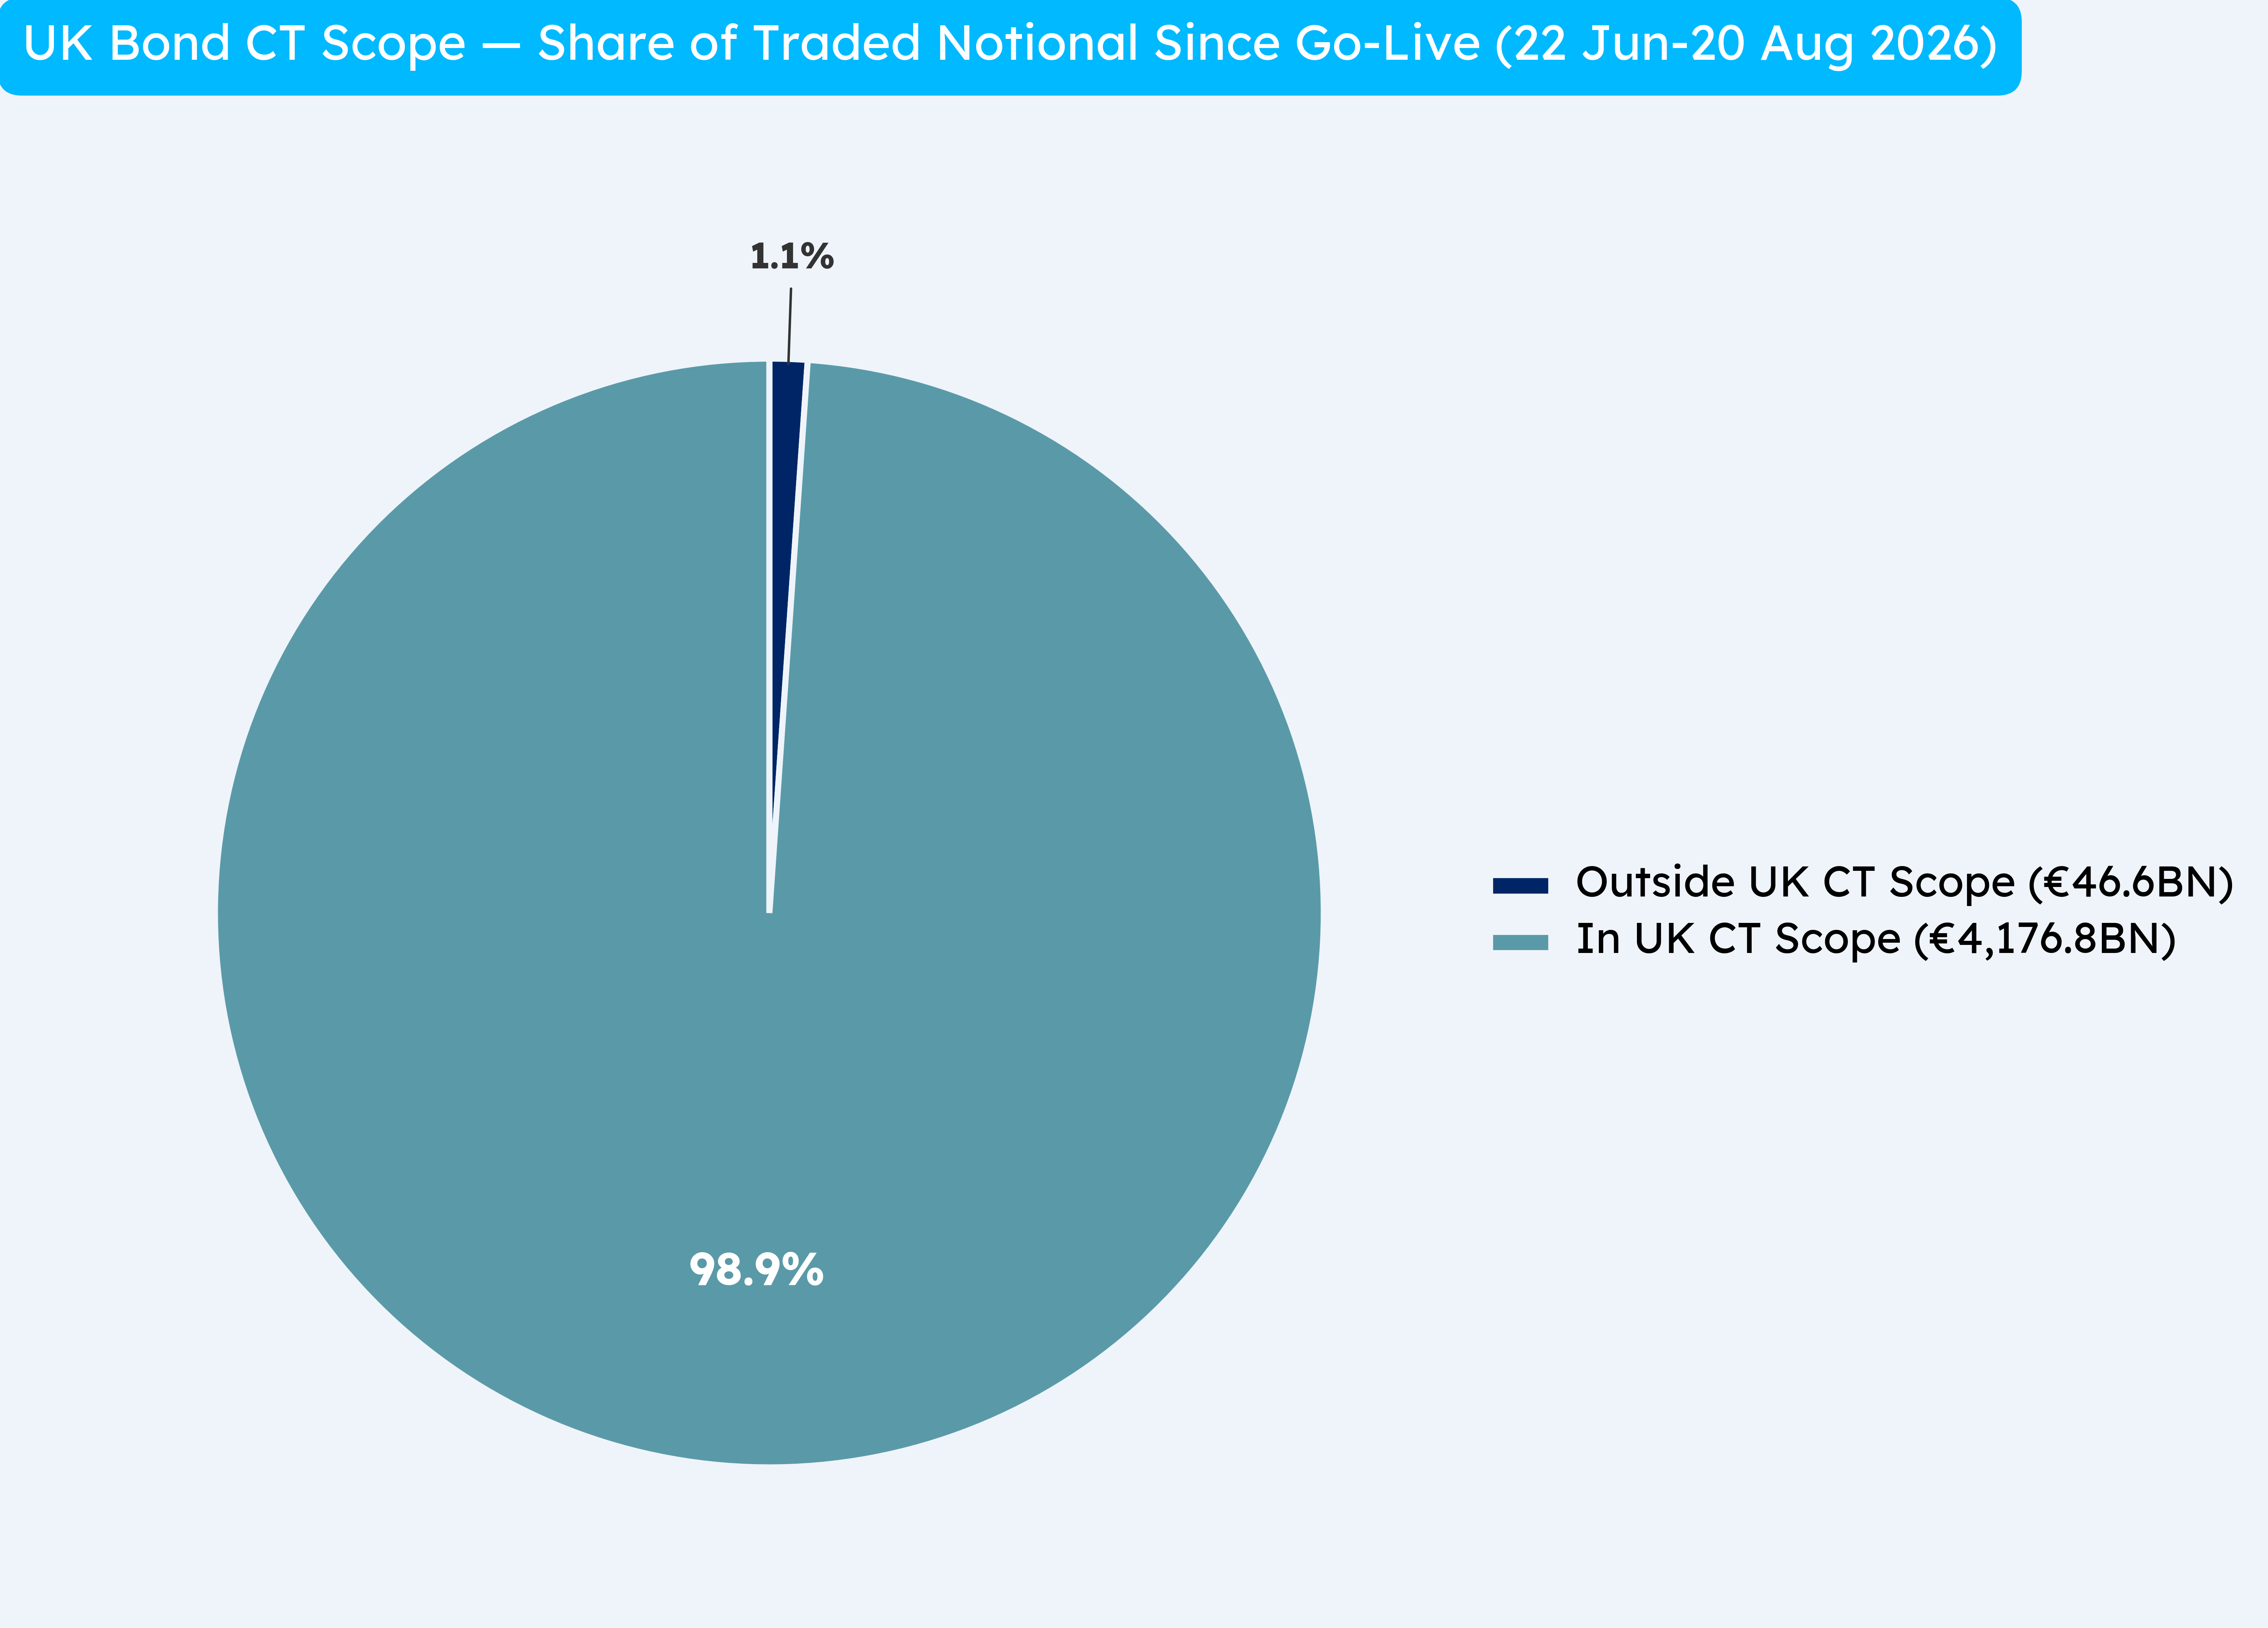
This confirms that the scope for the tape is sufficiently broad to capture the majority of flow. However it does not tell us the full story as when we look at trade count, we can see more than 1.3 million transactions (or around 26% of transactions) are not captured.
These tend to be smaller retail tickets (typically structured products) or asset backed securities (ABS).
When we looked at the expected off-tape volume back in June, it appeared the transaction count could be as high as 44% of all UK debt instrument transactions, with the volume potentially being just 8%, some way off the actual results reported.
When we look at the volumes reported via the UK tape, we see vanilla bonds and medium-term notes ‘MTNs’ (which are often referred to as ‘bonds’ by market participants), make up the bulk of flow as expected.
Municipal bonds are the next largest category at just under 2.5% (in this context these are typically regional or state issues, rather than US-muni’s, although they too would be captured here, should they trade in the UK).
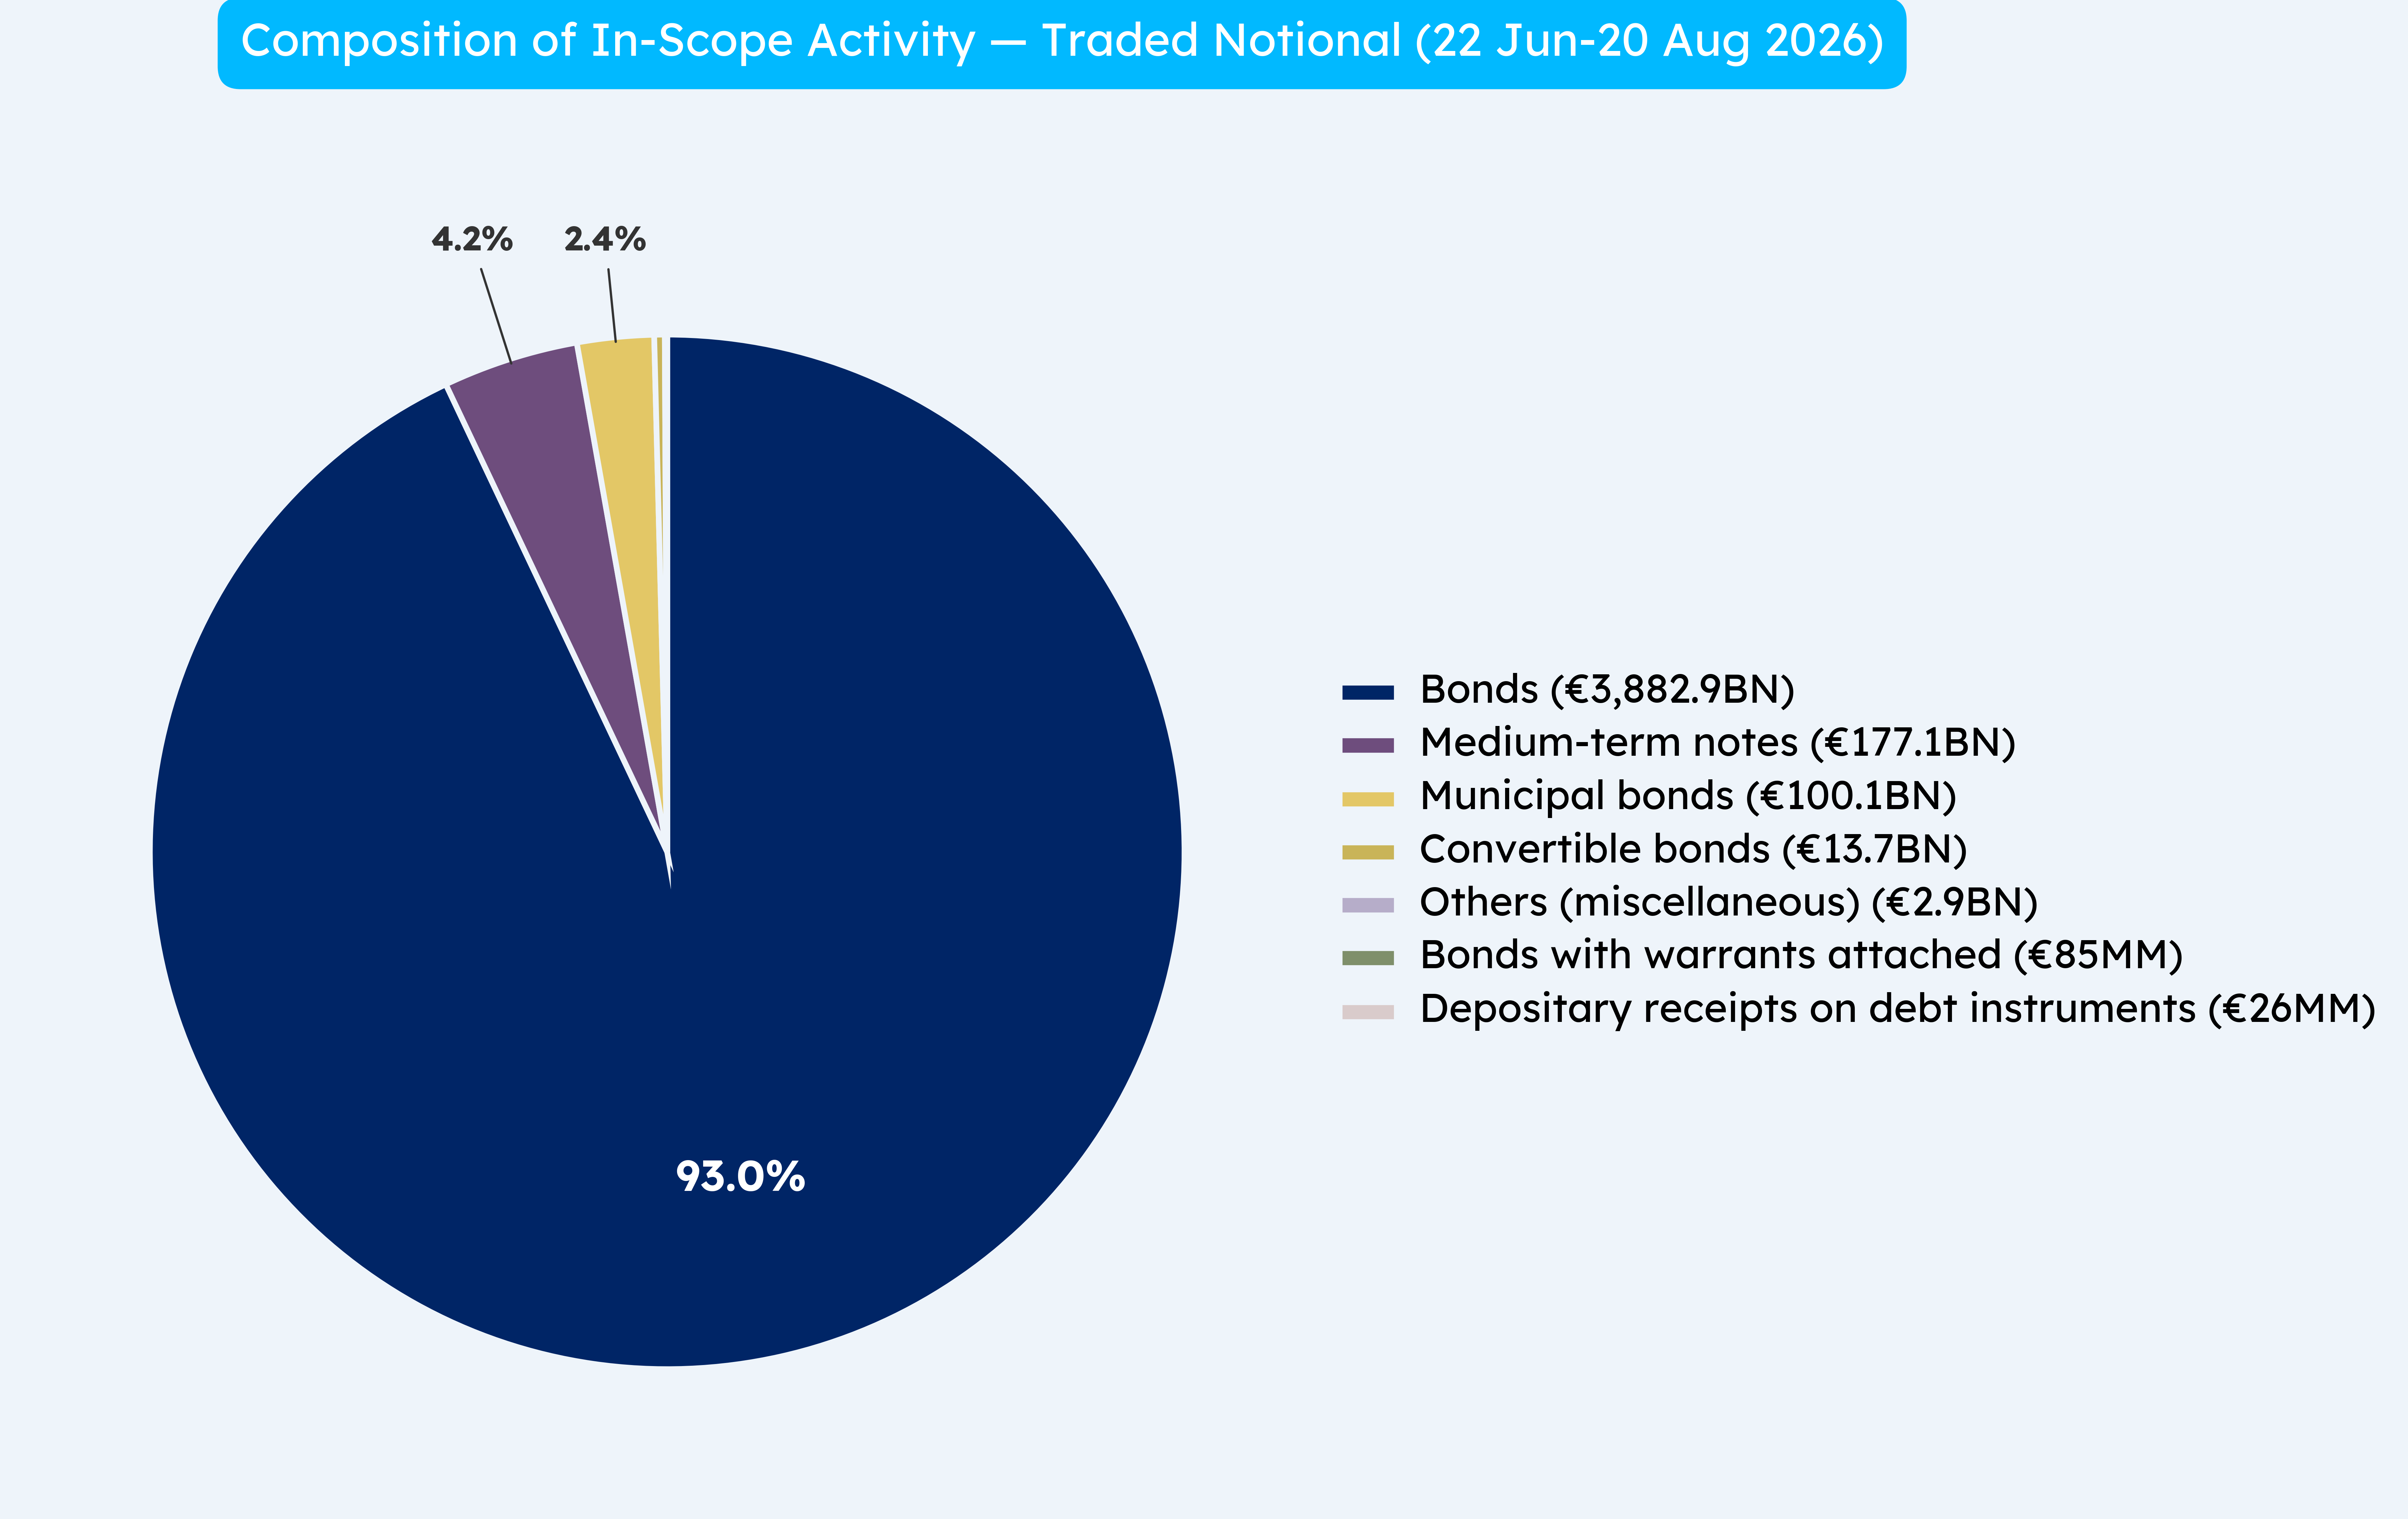
Moving on, we will next take a look at the typical deferral times, based on the sizing, for on-tape activity.
In this view we consider the average deferral time, but first, let us quickly recap how the deferrals are split into four buckets, based on size and type.
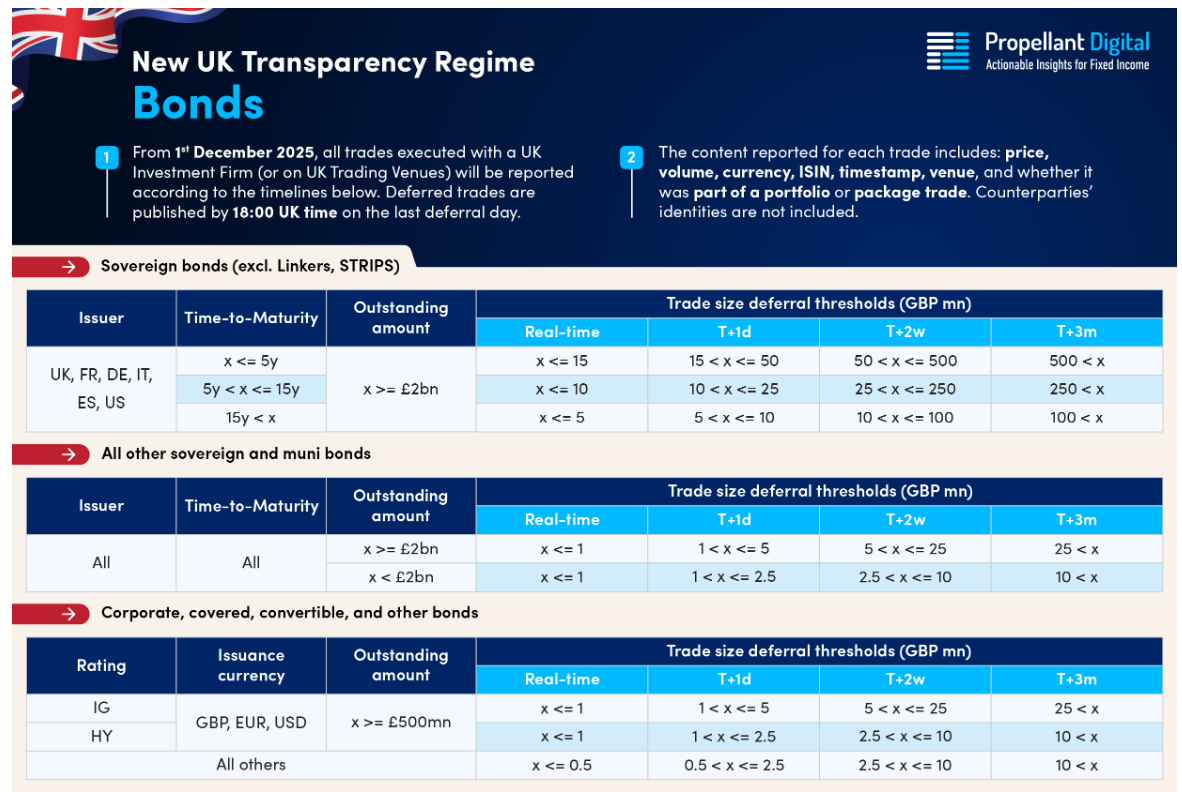
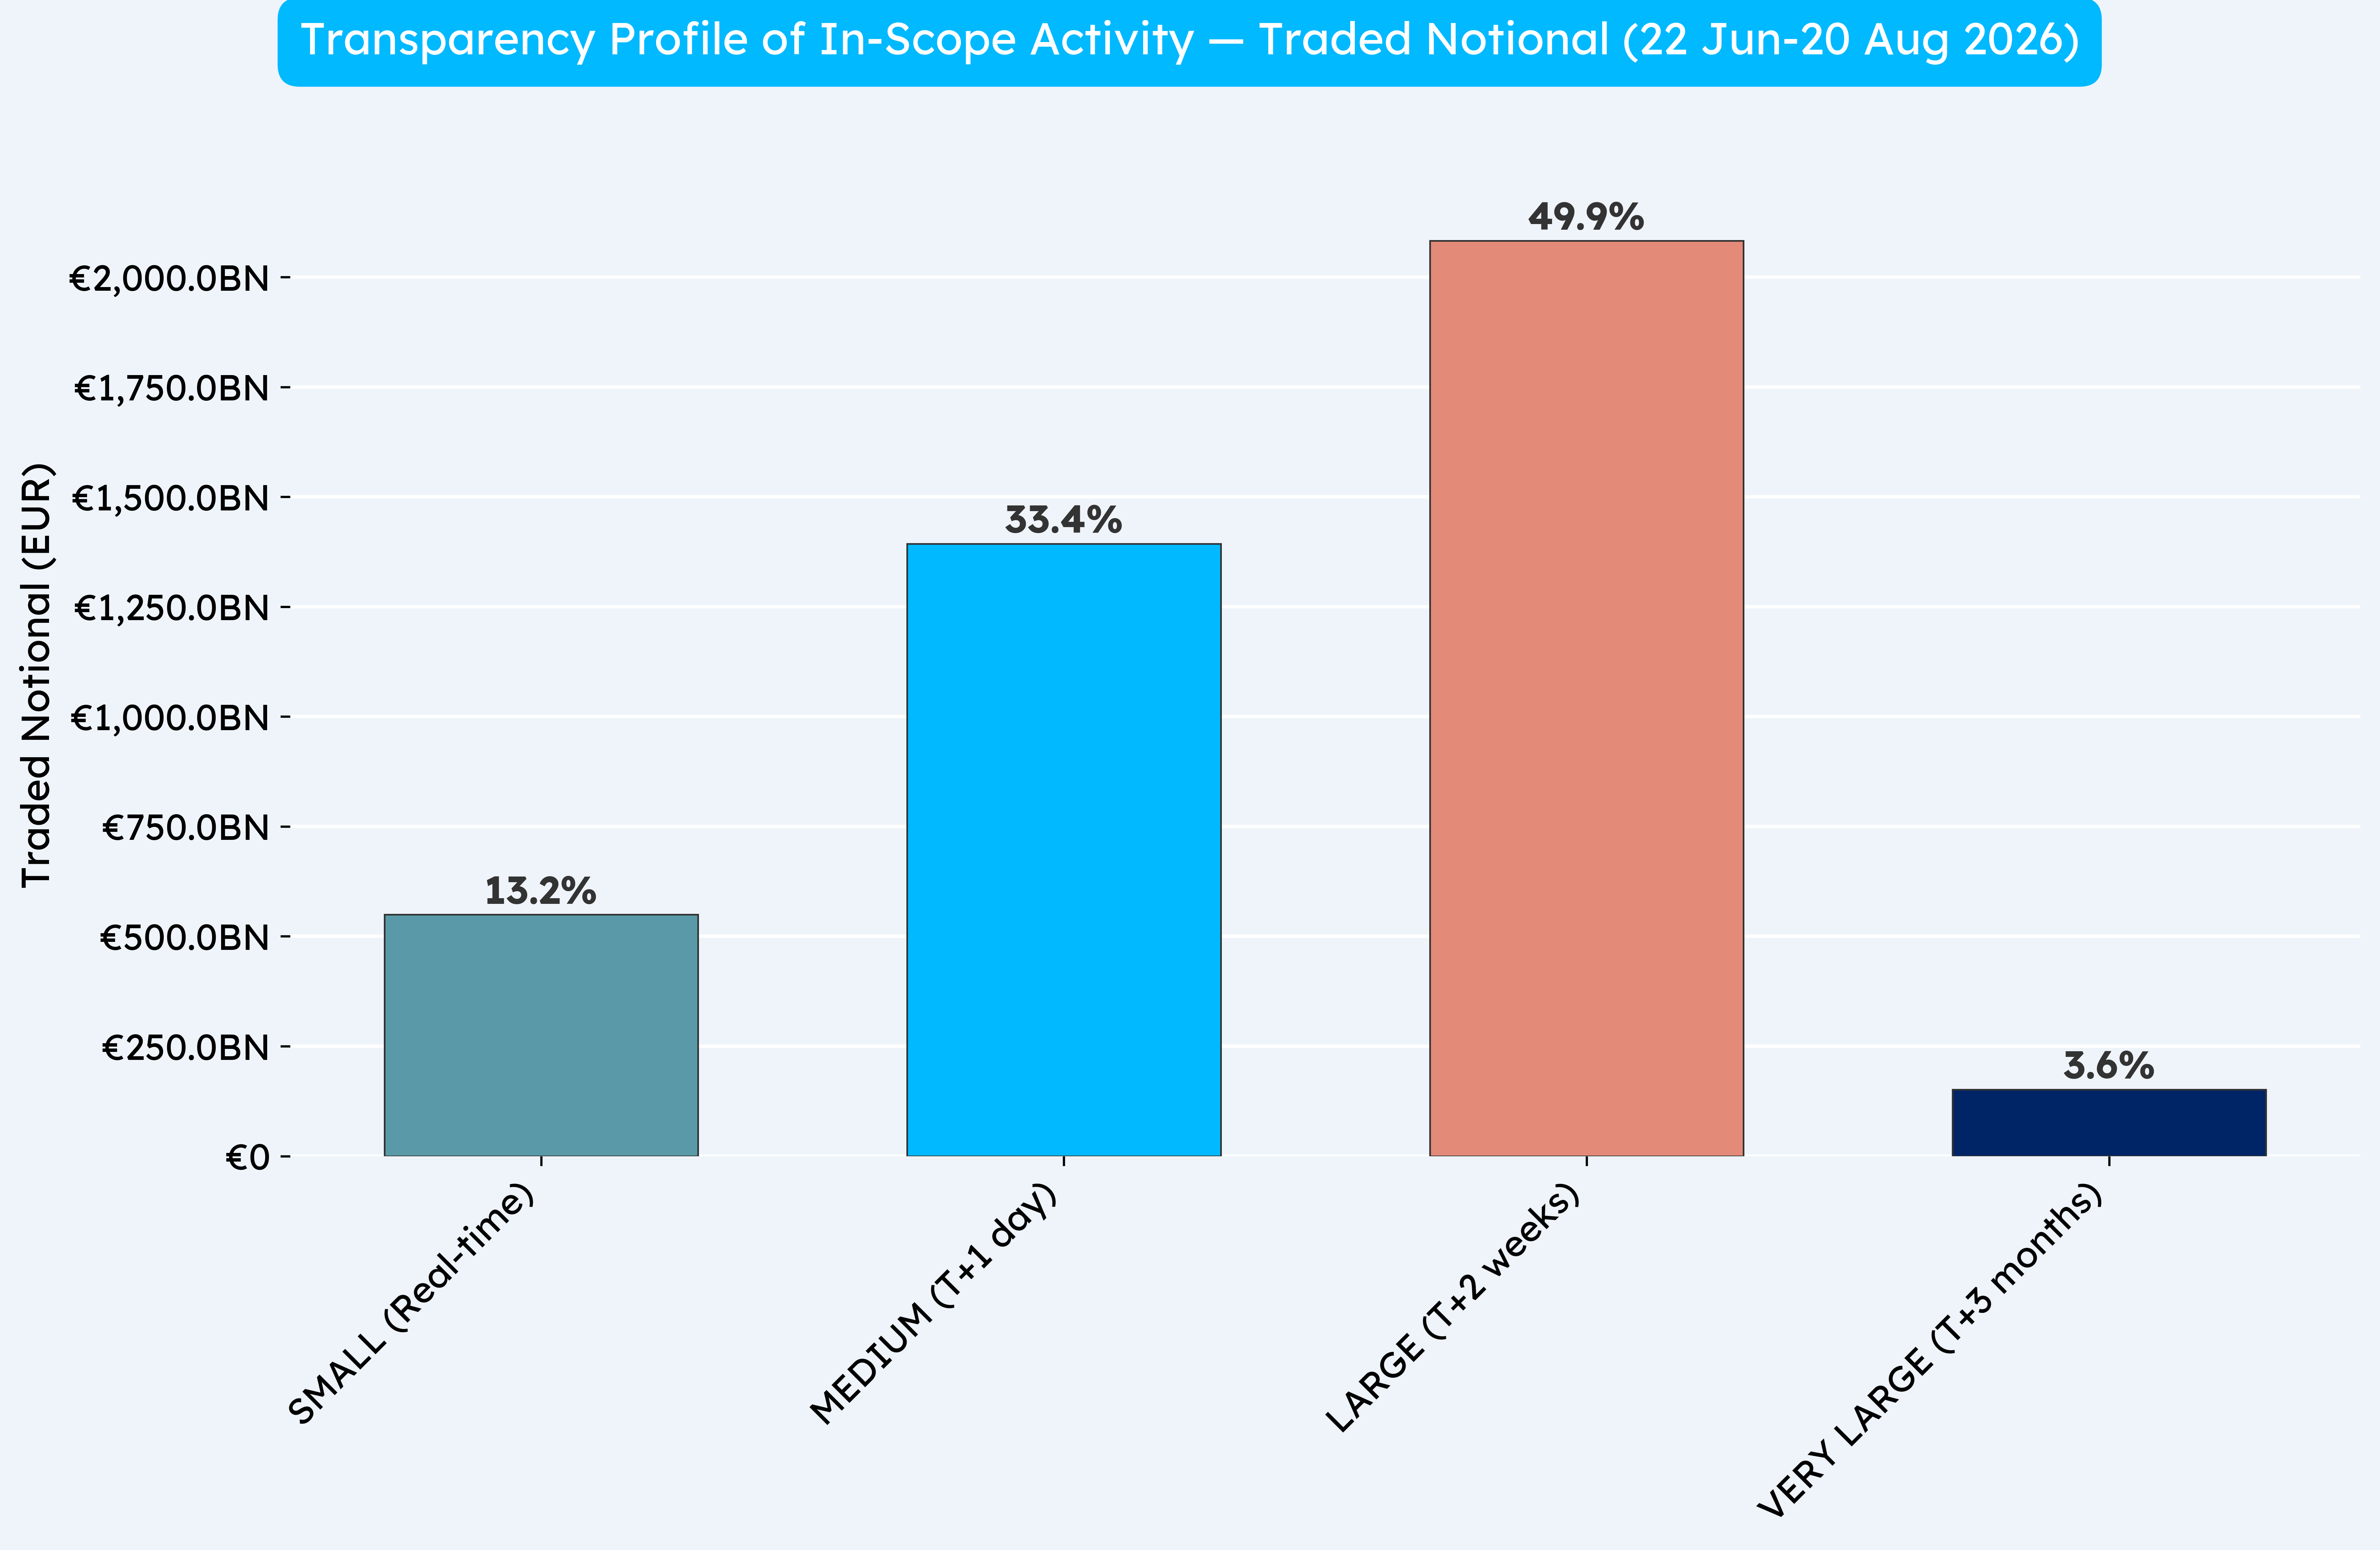
With only two months of data so far, it is inevitable the makeup of this chart will change in time. It is interesting to see the bulk of volume reported via the tape is deferred (when considering just volume).
Switching to off-tape activity we can quickly see the bulk of activity is on money market instruments, which are not mandatory to report under MiFID.
The reason transactions are often observed is simply because there is no universal alignment on the use of CFI codes for instrument classification, meaning some reference data sets may classify these differently.
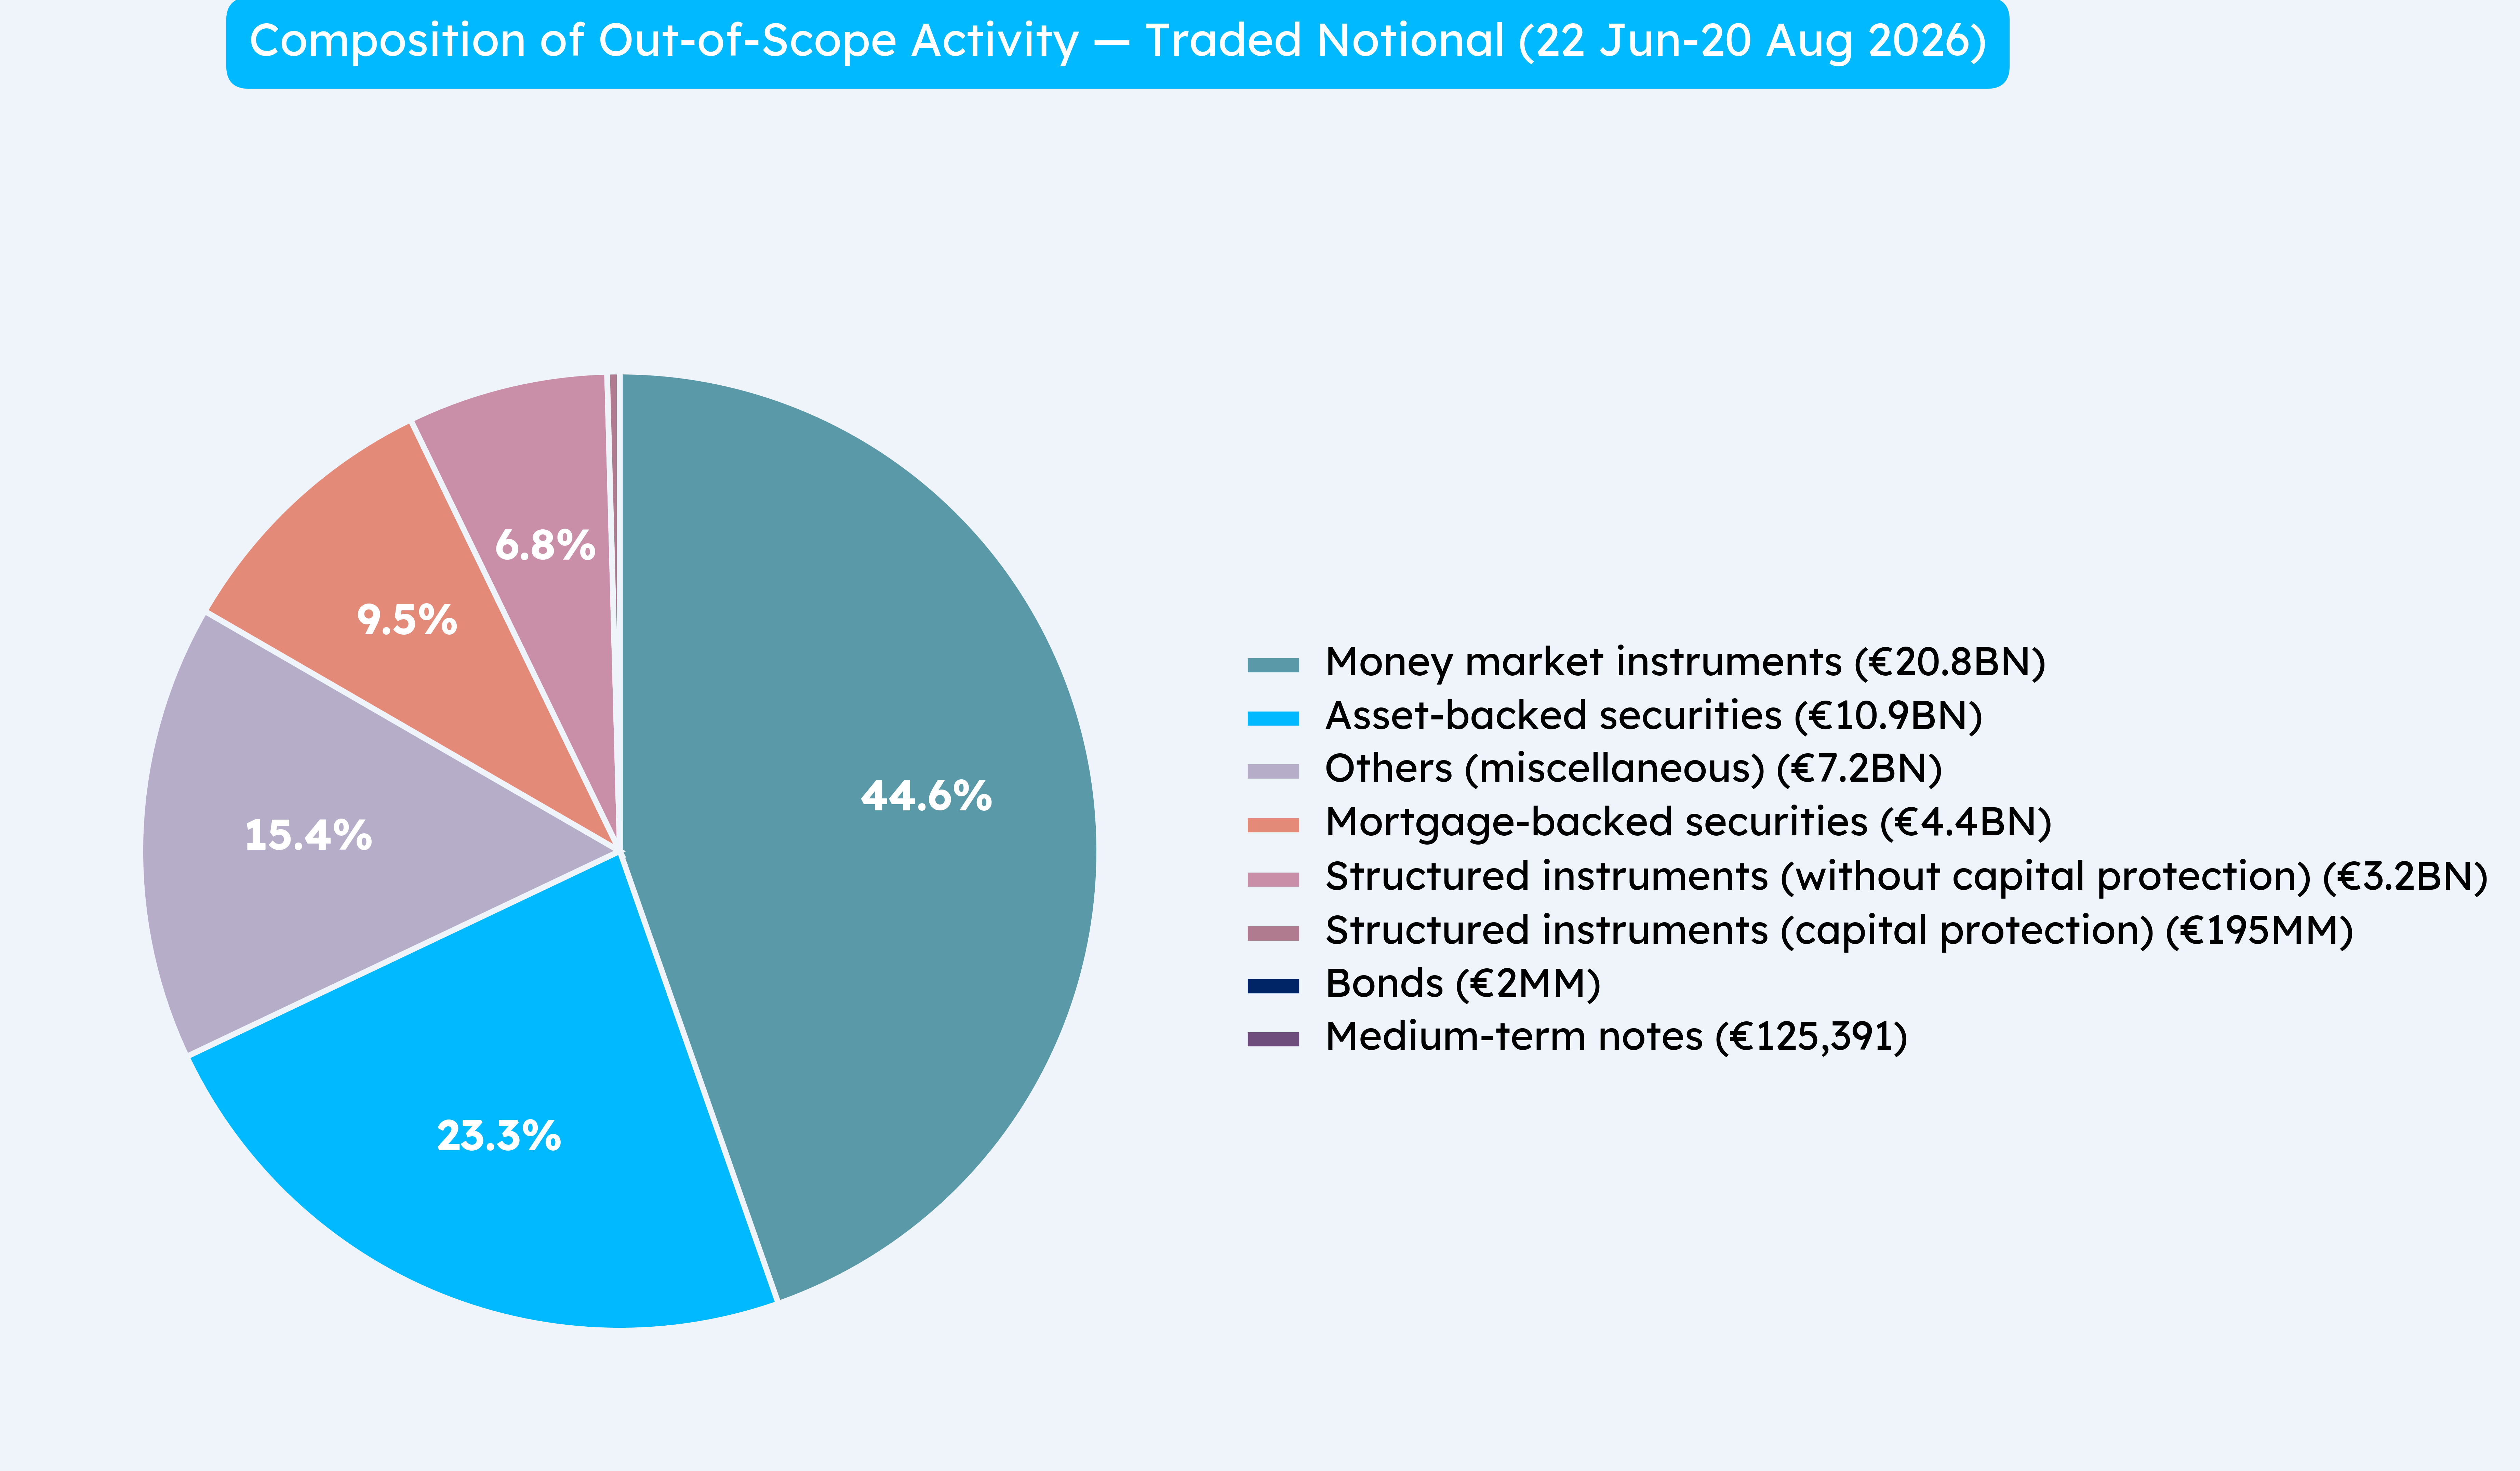
Aside from money market instruments, ABS and MBS combined make up the next biggest chunk. These are in-scope for MiFID reporting, but out-of-scope for the UK consolidated tape, along with structured products, therefore it is expected to see these trades making up such a high percentage of off tape activity.
With regards to off-tape deferrals, at a glance the chart might seem strange, because on-tape activity by volume saw a lower percentage of real-time activity.
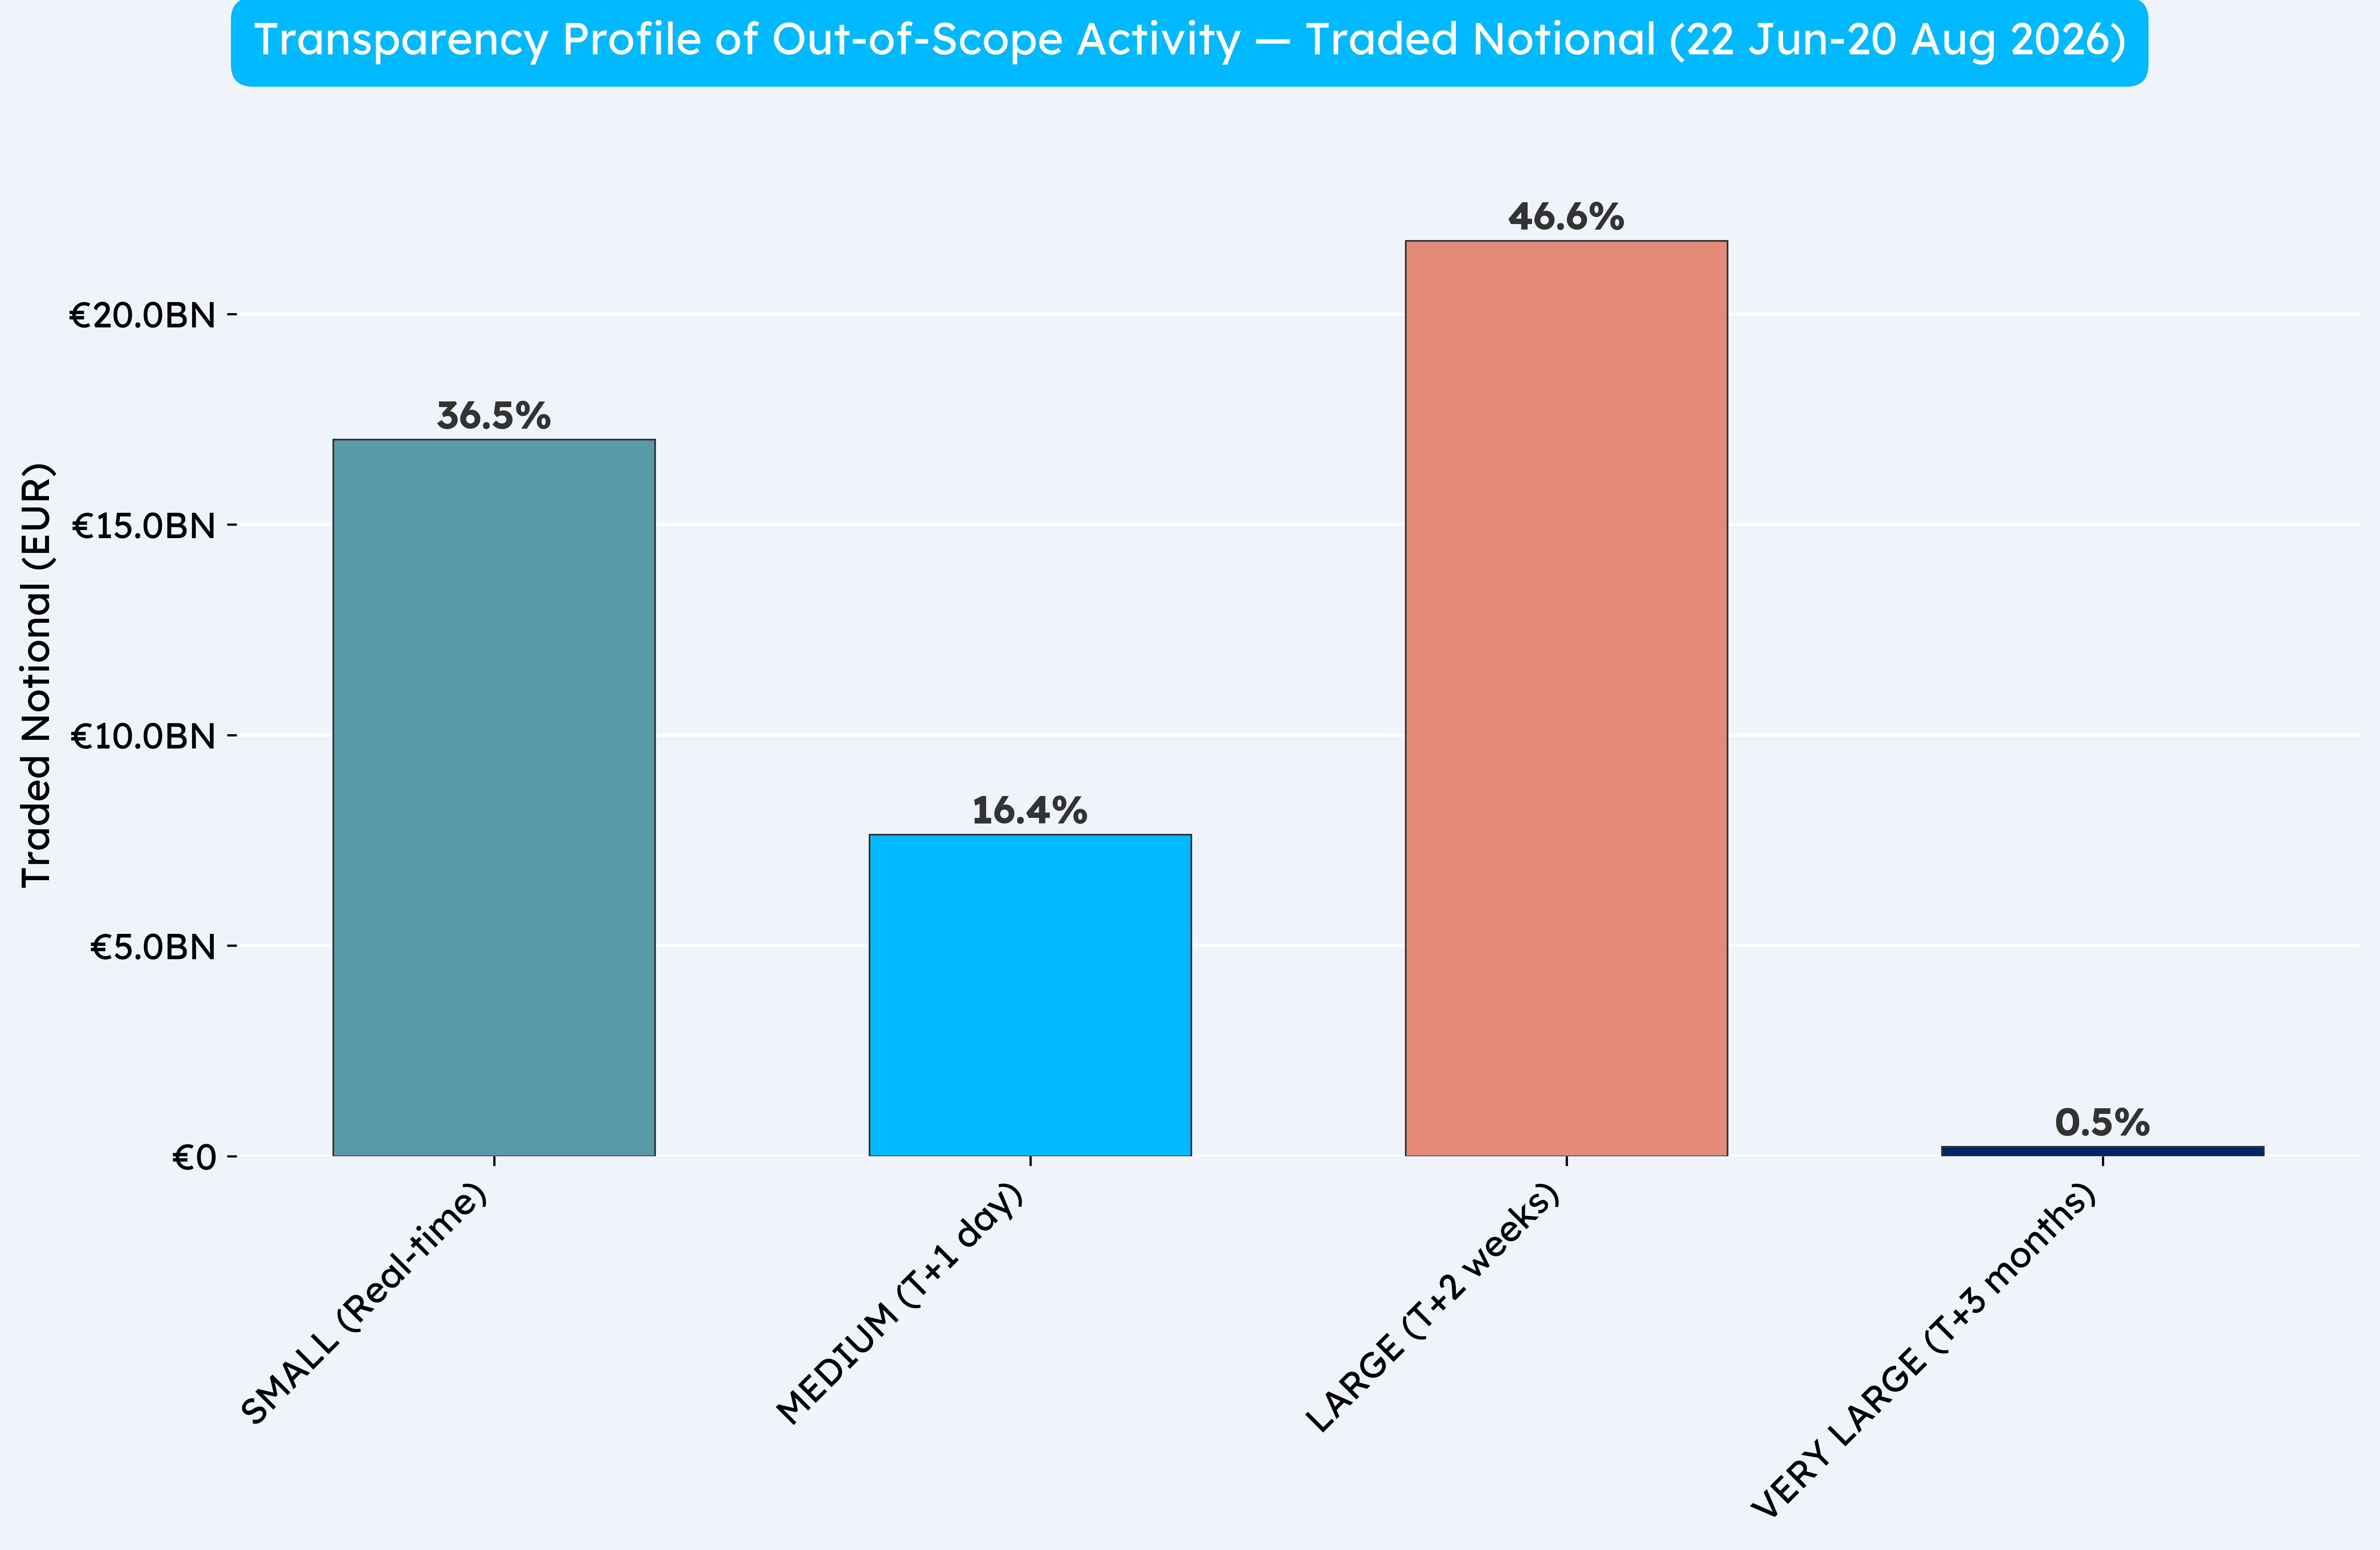
So why would the real-time percentage be so high for off-tape activity?
Off-tape activity can be subject to longer deferrals (on average), particularly due to category 2 reporting rules, which place the onus of determining the appropriate deferral time on the venue.
As a result of this, it is likely that proportionally a higher percentage of activity may not be reported yet (meaning the real-time percentage could drop significantly in time).
Additionally, some venues take a different approach and report faster than expected (i.e. often in real-time), meaning trades that would appear to qualify for a deferral do not always receive them.
As the maximum deferral permitted under category 2 is six months, we will need to wait until early 2027 to be able to fully assess the effects of these two scenarios.
The outcome of our initial look came as somewhat of a surprise, particularly the real-time percentage by volume, which was much lower than expected. We therefore could not finish this week without considering a different angle, i.e. the real-time percentage of on-tape activity by transaction count.
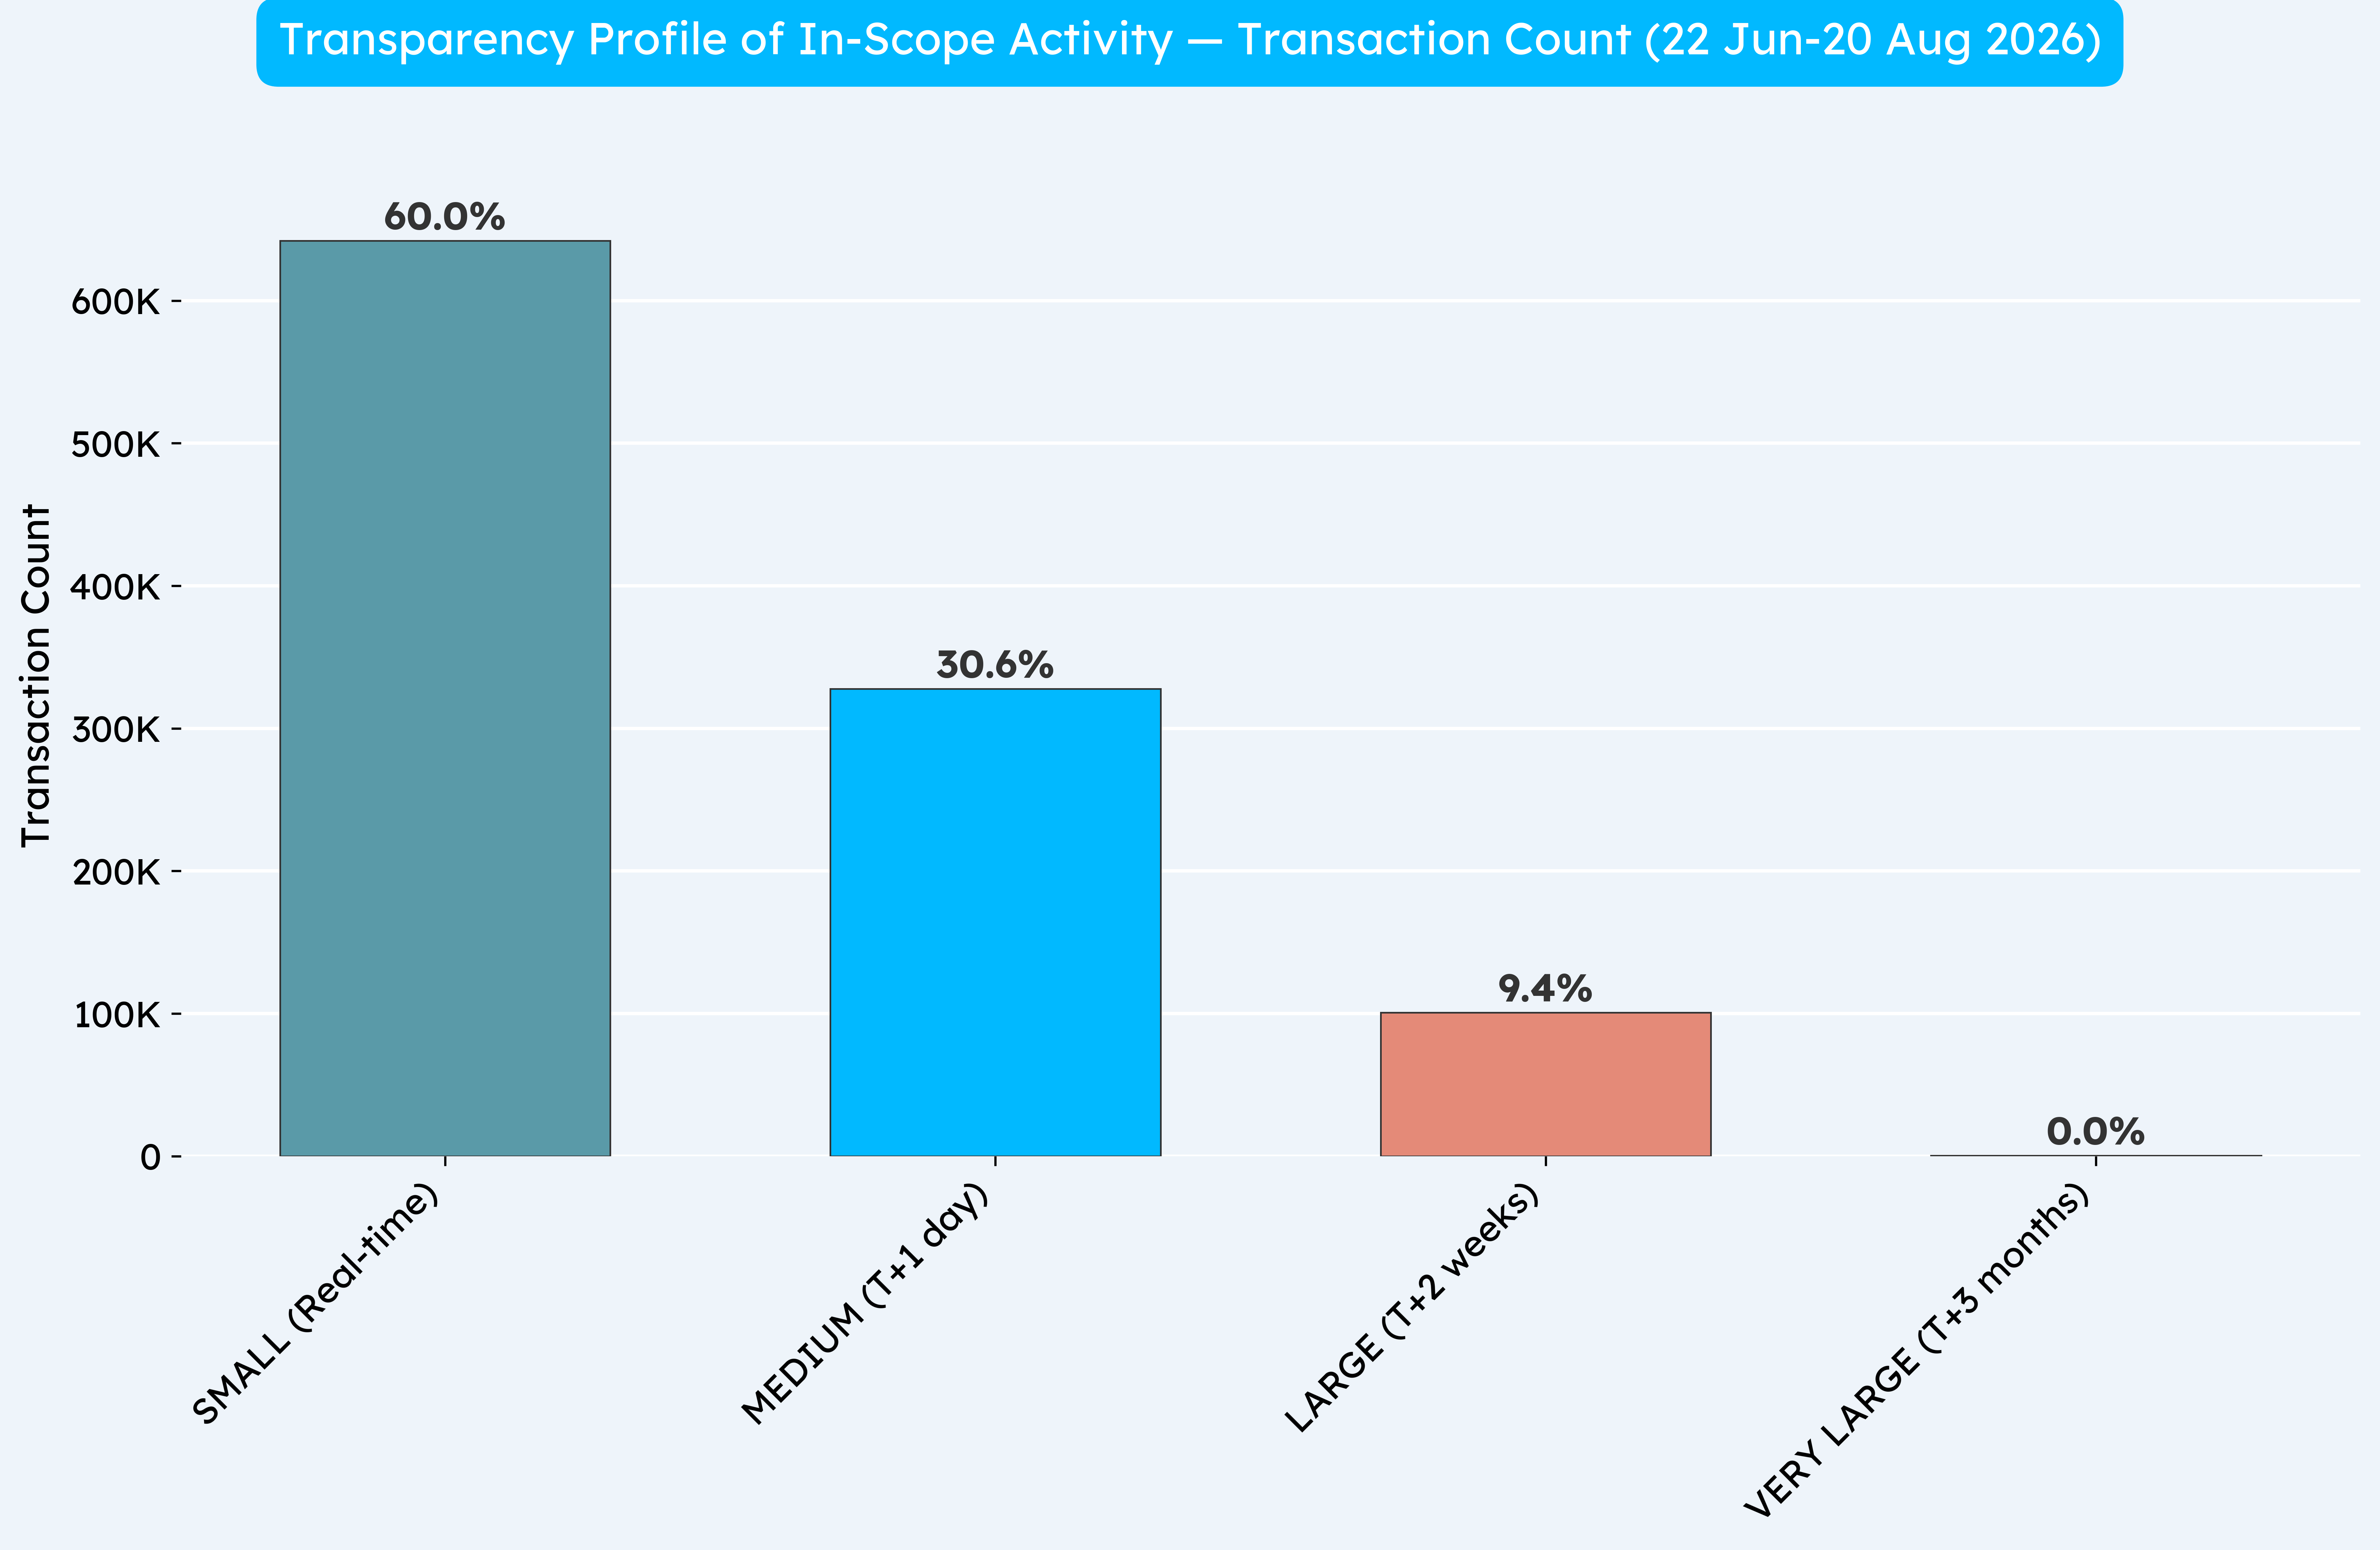
“Whilst the volume percentage of real-time activity was lower than expected, the tape is only two months old, so we aren’t seeing many very large deferred trades yet (which we’d need to determine the true percentages). We can, however, see in Chart 6 above the majority of transactions are reported and displayed in real-time, therefore it may be that over the last two months ticket sizes were abnormally large. Once we have more data, we will look at this in more depth.”


Original photograph taken by Richard Hadley
Dan Barnes - Dan is a highly experienced market commentator and founder of multiple media ventures including Trader TV and The Desk.
He is contributing as a guest editor for Propellant Insights ahead of starting a new venture in Q4 this year.
Vidal Mehra - Vidal is Chief Product Officer for Propellant Digital and the lead author for Propellant Insights.
He has been working with financial institutions for over 20 years across multiple disciplines including front office and consulting roles.

Helena Roughton - Helena recently joined the team as a Product Manager, bringing extensive MiFID policy experience having previously worked at AFME.
She also brings product remediation and data analysis experience from the Bank of New Zealand.
%20(10).png)
%20(9).png)